 NHL2026-10-21
NHL Picks for October 21: BUF 62% Leads a 2-Game Board
By Verdexed Analytics
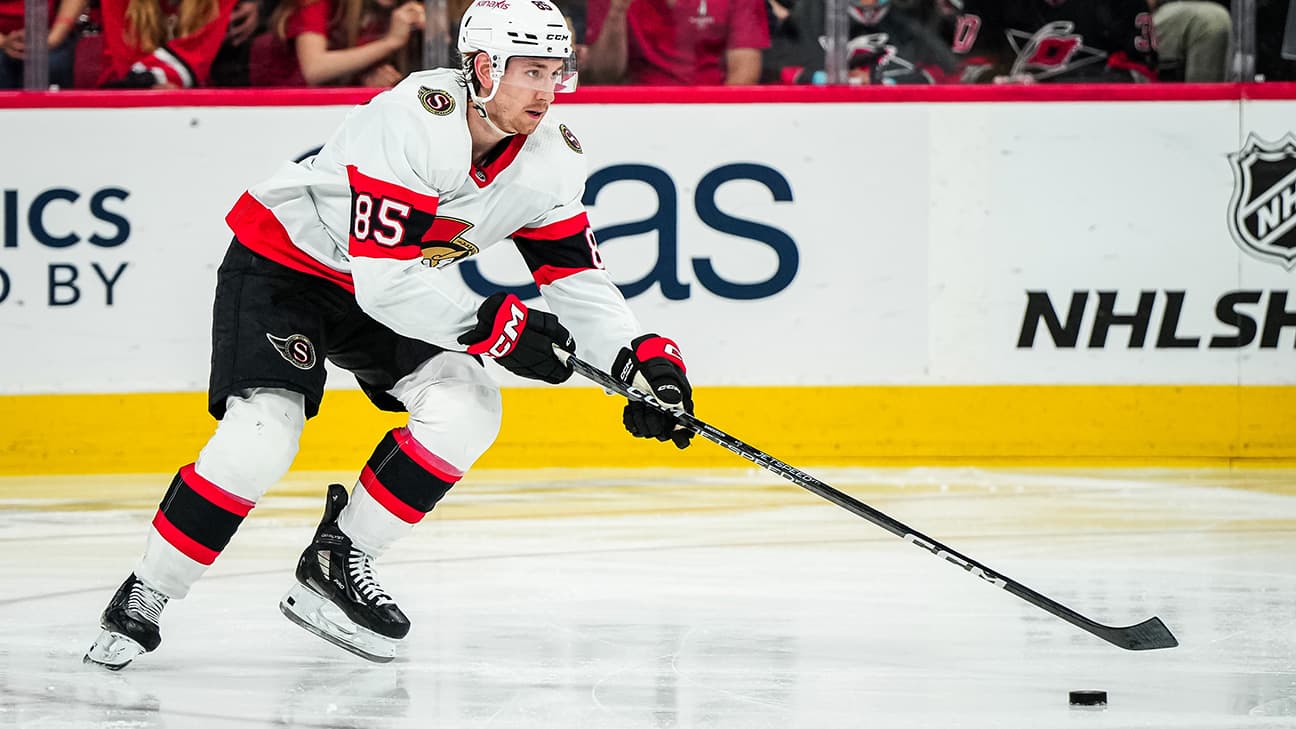
2 NHL games on the board for 2026-10-21. The firmest call is BUF at 62% over PHI; the model and the market broadly agree. Season to date the model is 92-59 (60.9%) on graded picks, Brier 0.231.
Every number here is the model's own: win probabilities from the point-in-time model blended with the market, the drivers from its feature breakdown, the player lines from the same projections that build the DFS slates, and the crew notes from the referee tables. A player line is the point where our distribution gives that side 57%: the over is a play at that line or lower, the under at that line or higher, at -120 or better.
The board
| Game | Pick | Verdexed | Market | Edge (pts) | Pick price | Line | Total | Card |
|---|---|---|---|---|---|---|---|---|
| PHI at BUF | BUF | 62% | 62% | 0 | -185 | BUF -1.5 | 5.5 | BUF -185 |
| FLA at OTT | FLA | 51% | 50.4% | 0 | -112 | FLA -1.5 | 5.5 | FLA -112 |
The pick is the more likely winner (the model blended with the market). The Model Card leg is a different question: the side whose price beats the model's own number. In a close game they can point at different teams; both are shown, and both are graded.
Game by game
Philadelphia Flyers at Buffalo Sabres: BUF 62%
The model has BUF at 62% against a market price of 62%. What drives it: expected goals (+9.3 points), expected goals (5v5) (+6.1 points), goal margin (+3.7 points). The case against is preseason prior (season-win futures, 9 and 11 games in) (-3.5 points). The line is BUF -1.5, total 5.5.
| PHI | BUF | |
|---|---|---|
| Record | 2-6-3 | 4-3-2 |
| Margin per game (goals) | -1.7 | -0.8 |
| Home / road | 0-4 | 3-2 |
| Streak | W2 | O1 |
| Last five | 2-3 | 2-3 |
| Rest days | 2 | 4 |
| Head to head | 3 wins | 3 wins |
PHI starter: Dan Vladar (projected). PHI out: Cam York, Rasmus Ristolainen, Nikita Grebenkin, Owen Tippett, Travis Konecny. BUF starter: Ukko-Pekka Luukkonen. BUF out: Alex Lyon, Sam Carrick, Conor Timmins, Jack Rathbone, Matt Grzelcyk.
| Player | Stat | Our projection | Over is a play at | Under is a play at |
|---|---|---|---|---|
| Tage Thompson | shots on goal | 3.5 | 2.5 or lower | 4.5 or higher |
| Rasmus Dahlin | shots on goal | 2.8 | 1.5 or lower | 3.5 or higher |
| Rasmus Dahlin | blocked shots | 2.1 | 1.5 or lower | 2.5 or higher |
| Trevor Zegras | shots on goal | 2.6 | 1.5 or lower | 3.5 or higher |
| Matvei Michkov | shots on goal | 1.6 | 0.5 or lower | 2.5 or higher |
| Jack Quinn | shots on goal | 2.2 | 1.5 or lower | 2.5 or higher |
Florida Panthers at Ottawa Senators: FLA 51%
The model has FLA at 51% against a market price of 50.4%. What drives it: expected goals (+2.9 points), streak (+2.0 points), preseason prior (season-win futures, 9 and 9 games in) (+1.8 points). The case against is shot margin (-3.0 points). The line is FLA -1.5, total 5.5.
| FLA | OTT | |
|---|---|---|
| Record | 5-2-2 | 6-3 |
| Margin per game (goals) | +0.6 | +0.1 |
| Home / road | 3-1 | 3-1 |
| Streak | W3 | L1 |
| Last five | 3-2 | 3-2 |
| Rest days | 4 | 4 |
| Head to head | 4 wins | 2 wins |
FLA starter: Akira Schmid (projected). FLA out: Jacob Markstrom, Aleksander Barkov, Brad Marchand, Jonah Gadjovich. OTT starter: Linus Ullmark (projected). OTT out: Thomas Chabot, Kurtis MacDermid, William Eklund.
| Player | Stat | Our projection | Over is a play at | Under is a play at |
|---|---|---|---|---|
| Brady Tkachuk | shots on goal | 4.2 | 3.5 or lower | 4.5 or higher |
| Matthew Tkachuk | shots on goal | 2.6 | 1.5 or lower | 3.5 or higher |
| Matthew Tkachuk | assists | 1.6 | 0.5 or lower | 2.5 or higher |
| Sam Reinhart | shots on goal | 3 | 2.5 or lower | 3.5 or higher |
| Jake Sanderson | shots on goal | 2.3 | 1.5 or lower | 2.5 or higher |
| Jake Sanderson | blocked shots | 2 | 1.5 or lower | 2.5 or higher |
| Seth Jones | shots on goal | 2.4 | 1.5 or lower | 2.5 or higher |
| Seth Jones | assists | 1.3 | 0.5 or lower | 1.5 or higher |
Anytime goal list
| Player | Team | Expected | Our probability | Fair price | Take at |
|---|---|---|---|---|---|
| Brady Tkachuk | FLA | 1.00 | 63% | -172 | -150 |
| Sam Reinhart | FLA | 0.76 | 53% | -114 | -102 |
| Carter Verhaeghe | FLA | 0.73 | 52% | -107 | +103 |
| Matvei Michkov | PHI | 0.63 | 47% | +114 | +125 |
| Sam Bennett | FLA | 0.56 | 43% | +133 | +145 |
| Tage Thompson | BUF | 0.52 | 40% | +147 | +160 |
| Jake Sanderson | OTT | 0.48 | 38% | +162 | +176 |
| Jack Quinn | BUF | 0.41 | 34% | +198 | +213 |
| Drake Batherson | OTT | 0.39 | 32% | +210 | +226 |
| Tim Stützle | OTT | 0.38 | 32% | +216 | +233 |
| Trevor Zegras | PHI | 0.36 | 30% | +231 | +249 |
| Jason Zucker | BUF | 0.36 | 30% | +231 | +249 |
Yesterday's board
11 games, the model went 6-5.
| Game | Pick | Verdexed | Model alone | Market | Final | Result | Card |
|---|---|---|---|---|---|---|---|
| CAR at VAN | CAR | 68% | 65% | 72% | CAR 6-3 | Hit | CAR -298 (hit) |
| SJS at MTL | MTL | 63% | 59% | 64% | SJS 4-3 | Miss | MTL -225 (miss) |
| BOS at DAL | DAL | 60% | 58% | 60% | DAL 3-2 | Hit | DAL -170 (hit) |
| LAK at WSH | WSH | 59% | 57% | 59% | LAK 5-2 | Miss | WSH -155 (miss) |
| TOR at CBJ | CBJ | 59% | 57% | 59% | TOR 6-2 | Miss | - |
| ANA at NYI | NYI | 57% | 53% | 58% | NYI 3-2 | Hit | - |
| WPG at STL | STL | 57% | 55% | 57% | STL 2-1 | Hit | - |
| MIN at EDM | EDM | 55% | 55% | 55% | EDM 4-3 | Hit | - |
| TBL at VGK | VGK | 51% | 52% | 51% | TBL 6-2 | Miss | - |
| DET at SEA | SEA | 51% | 49% | 51% | SEA 4-3 | Hit | - |
| COL at NJD | COL | 50.3% | 51% | 50.0% | NJD 4-3 | Miss | - |
Where the model and the market split: DET at SEA: the model took DET (51%), the market SEA; the served pick was SEA and the pick hit. COL at NJD: the model took COL (51%), the market NJD; the served pick was COL and the pick missed. CAR over VAN: model 65%, market 72%, a 7-point gap; the pick hit. MTL over SJS: model 59%, market 64%, a 5-point gap; the pick missed. NYI over ANA: model 53%, market 58%, a 5-point gap; the pick hit.
The firmest calls: CAR 68% over VAN (hit), MTL 63% over SJS (miss), DAL 60% over BOS (hit).
The Model Card is a different question from the pick: the pick is the more likely winner, the card leg is the side whose price beats the model's own number. The card went 2-2 on its 4 legs here.
Season to date through October 20: 92-59 (60.9%), Brier 0.231; picks at 60% or better are 28-10.
The record
Graded regular-season picks since 2026-09-29: 92 of 151 (60.9%), Brier score 0.231. The live figure, the hit rate by confidence band and every voided pick with its reason are on the NHL accuracy page.
Responsible play
This is model output, not betting advice. Verdexed publishes its model's probabilities and edges for informational and entertainment purposes only. Nothing here is a recommendation to place a wager, and no outcome is guaranteed, even the model's highest-confidence picks lose regularly.
You must be of legal betting age in your jurisdiction and located where sports wagering is legal to bet. Sports betting is not available everywhere; know and follow the laws where you are. Never bet more than you can afford to lose, and never chase losses.
If gambling is affecting you or someone you know, help is available. In the US, call or text 1-800-GAMBLER (1-800-426-2537), or visit ncpgambling.org. Please play responsibly.