 NFL2026-10-06
NFL Week 5 Picks: DAL 75% and the Model's Call on All 15 Games
By Verdexed Analytics
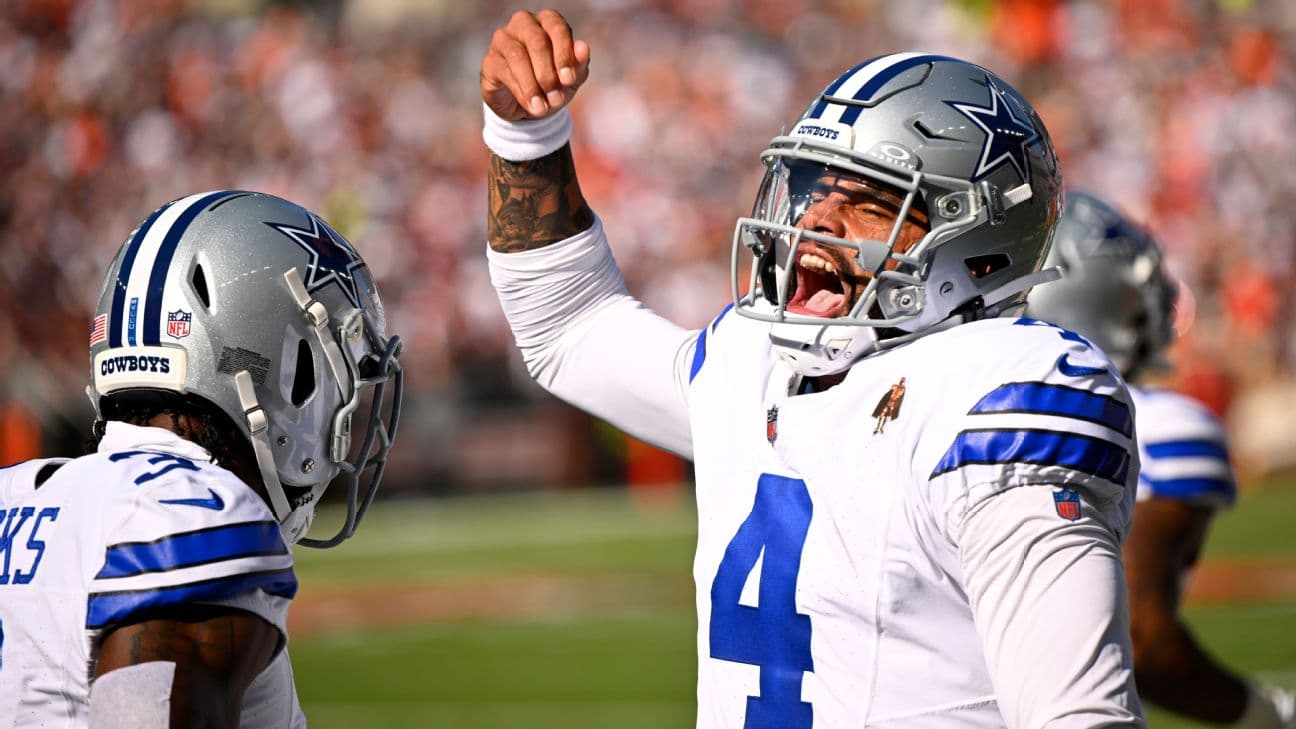
15 NFL games on the board for Week 5. The firmest call is DAL at 75% over TB; the model and the market are 3 points or more apart on 12. Season to date the model is 39-24 (61.9%) on graded picks, Brier 0.227.
Every number here is the model's own: win probabilities from the point-in-time model blended with the market, the drivers from its feature breakdown, the player lines from the same projections that build the DFS slates, and the crew notes from the referee tables. A player line is the point where our distribution gives that side 57%: the over is a play at that line or lower, the under at that line or higher, at -120 or better.
The board
| Game | Pick | Verdexed | Market | Edge (pts) | Pick price | Line | Total |
|---|---|---|---|---|---|---|---|
| TB at DAL | DAL | 75% | 79% | -4 | -455 | DAL -8.5 | 47.5 |
| PHI at JAX | JAX | 71% | 70% | +1 | -278 | JAX -6.5 | 42.5 |
| CIN at MIA | CIN | 71% | 74% | -4 | -345 | CIN -7.0 | 42.5 |
| MIN at NO | MIN | 70% | 54% | +16 | -130 | MIN -1.5 | 42.5 |
| DET at ARI | DET | 68% | 66% | +2 | -218 | DET -4.5 | 54.5 |
| HOU at TEN | HOU | 67% | 73% | -7 | -325 | HOU -7.0 | 38.5 |
| CLE at NYJ | CLE | 62% | 46% | +16 | +110 | NYJ -2.5 | 39.5 |
| CHI at GB | CHI | 62% | 57% | +5 | -148 | CHI -3.0 | 45.5 |
| DEN at LAC | DEN | 59% | 62% | -4 | -185 | DEN -3.5 | 42.5 |
| IND at PIT | PIT | 57% | 55% | +1 | -135 | PIT -2.5 | 44.5 |
| SF at SEA | SEA | 55% | 58% | -3 | -155 | SEA -3.0 | 47.5 |
| NYG at WSH | WSH | 54% | 60% | -6 | -166 | WSH -3.0 | 43.5 |
| BAL at ATL | BAL | 54% | 42% | +12 | +130 | ATL -3.0 | 43.5 |
| LV at NE | NE | 53% | 63% | -10 | -192 | NE -3.5 | 45.5 |
| BUF at LAR | LAR | 50.4% | 57% | -7 | -148 | LAR -2.5 | 54.5 |
Where the model and the market disagree
MIN over NO: we make it 70%, the market 54%. The edge comes from point margin (+9.5 points), head to head (+2.0 points).
CLE over NYJ: we make it 62%, the market 46%. The edge comes from injuries (nyj without hall, mitchell) (+6.0 points), venue (+2.4 points).
CHI over GB: we make it 62%, the market 57%. The edge comes from point margin (+11.3 points), offense (+6.8 points).
BAL over ATL: we make it 54%, the market 42%. The edge comes from offense (+5.1 points), point margin (+5.1 points).
The market is more confident than we are on these. We still expect the favourite to win, but on our numbers the other side carries the value at the market's price:
DAL over TB: we make it 75%, the market 79% (a 4-point gap).
CIN over MIA: we make it 71%, the market 74% (a 4-point gap).
HOU over TEN: we make it 67%, the market 73% (a 7-point gap).
DEN over LAC: we make it 59%, the market 62% (a 4-point gap).
SEA over SF: we make it 55%, the market 58% (a 3-point gap).
WSH over NYG: we make it 54%, the market 60% (a 6-point gap).
NE over LV: we make it 53%, the market 63% (a 10-point gap).
LAR over BUF: we make it 50.4%, the market 57% (a 7-point gap).
Game by game
Tampa Bay Buccaneers at Dallas Cowboys: DAL 75%
The model has DAL at 75% against a market price of 79%. What drives it: offense (+6.4 points), quarterback (+4.1 points), point margin (+3.8 points). The case against is third downs (-1.1 points). The line is DAL -8.5, total 47.5. That is a 4-point gap to the market, so the market likes this side more than we do; treat the pick as a lean.
| TB | DAL | |
|---|---|---|
| Record | 0-4 | 2-2 |
| Margin per game (pts) | -5.0 | +2.5 |
| Home / road | 0-1 | 1-1 |
| Streak | L4 | W1 |
| Last five | 0-4 | 2-2 |
| Rest days | 4 | 4 |
| Head to head | 2 wins | 1 wins |
TB starter: Jalon Daniels. TB out: Baker Mayfield, Ko Kieft, Antoine Winfield Jr., Benjamin Morrison. DAL starter: Dak Prescott. DAL out: Cobie Durant, DeMarvion Overshown, Jalen Thompson, Jonathan Bullard, Tyler Smith.
| Player | Stat | Our projection | Over is a play at | Under is a play at |
|---|---|---|---|---|
| Dak Prescott | passing yards | 335 | 309.5 or lower | 343.5 or higher |
| Dak Prescott | rushing yards | 15.8 | 11.5 or lower | 15.5 or higher |
| Jalon Daniels | passing yards | 193.8 | 178.5 or lower | 198.5 or higher |
| Jalon Daniels | rushing yards | 46.8 | 33.5 or lower | 45.5 or higher |
| Javonte Williams | rushing yards | 77.2 | 65.5 or lower | 78.5 or higher |
| Javonte Williams | receptions | 2.5 | 1.5 or lower | 3.5 or higher |
| CeeDee Lamb | receptions | 5.7 | 4.5 or lower | 6.5 or higher |
| CeeDee Lamb | receiving yards | 79.3 | 65.5 or lower | 80.5 or higher |
| Bucky Irving | rushing yards | 58.7 | 49.5 or lower | 59.5 or higher |
| Bucky Irving | receptions | 2.6 | 1.5 or lower | 3.5 or higher |
| George Pickens | receptions | 3.9 | 2.5 or lower | 4.5 or higher |
| George Pickens | receiving yards | 57.8 | 47.5 or lower | 58.5 or higher |
Philadelphia Eagles at Jacksonville Jaguars: JAX 71%
The model has JAX at 71% against a market price of 70%. What drives it: point margin (+10.2 points), injuries (phi without smith, goedert) (+7.5 points), offense (+5.5 points). The case against is defense (-3.5 points). The line is JAX -6.5, total 42.5.
| PHI | JAX | |
|---|---|---|
| Record | 2-2 | 3-1 |
| Margin per game (pts) | -4.5 | +12.8 |
| Home / road | 1-1 | 2-0 |
| Streak | L2 | W2 |
| Last five | 2-2 | 3-1 |
| Rest days | 7 | 7 |
| Head to head | 2 wins | 0 wins |
PHI starter: Jalen Hurts. PHI out: Tank Bigsby, DeVonta Smith, Hollywood Brown, Dallas Goedert, Chance Campbell. JAX starter: Trevor Lawrence. JAX out: Christian Braswell, Montaric Brown.
| Player | Stat | Our projection | Over is a play at | Under is a play at |
|---|---|---|---|---|
| Trevor Lawrence | passing yards | 192.9 | 178.5 or lower | 197.5 or higher |
| Trevor Lawrence | rushing yards | 15.8 | 11.5 or lower | 15.5 or higher |
| Jalen Hurts | passing yards | 163.2 | 150.5 or lower | 167.5 or higher |
| Jalen Hurts | rushing yards | 20.3 | 14.5 or lower | 19.5 or higher |
| Bhayshul Tuten | rushing yards | 52.5 | 44.5 or lower | 53.5 or higher |
| Parker Washington | receptions | 3.5 | 2.5 or lower | 4.5 or higher |
| Parker Washington | receiving yards | 49.7 | 41.5 or lower | 50.5 or higher |
| Dontayvion Wicks | receptions | 3.7 | 2.5 or lower | 4.5 or higher |
| Dontayvion Wicks | receiving yards | 45.8 | 37.5 or lower | 46.5 or higher |
| Saquon Barkley | rushing yards | 52.7 | 44.5 or lower | 53.5 or higher |
| Saquon Barkley | receptions | 1.8 | 0.5 or lower | 2.5 or higher |
Cincinnati Bengals at Miami Dolphins: CIN 71%
The model has CIN at 71% against a market price of 74%. What drives it: point margin (+8.9 points), offense (+6.9 points), injuries (mia without achane) (+6.6 points). The case against is quarterback (-1.9 points). The line is CIN -7.0, total 42.5. That is a 4-point gap to the market, so the market likes this side more than we do; treat the pick as a lean.
| CIN | MIA | |
|---|---|---|
| Record | 2-2 | 0-4 |
| Margin per game (pts) | +3.0 | -13.8 |
| Home / road | 1-1 | 0-1 |
| Streak | L2 | L4 |
| Last five | 2-2 | 0-4 |
| Rest days | 7 | 7 |
| Head to head | 2 wins | 0 wins |
CIN starter: Joe Burrow. CIN out: Colbie Young, B.J. Hill, Bryan Cook, Jalen Davis, Kyle Dugger. MIA starter: Malik Willis. MIA out: De'Von Achane, Caleb Douglas, Kenneth Grant, Reese Taylor, Robert Beal Jr..
| Player | Stat | Our projection | Over is a play at | Under is a play at |
|---|---|---|---|---|
| Joe Burrow | passing yards | 289.3 | 267.5 or lower | 296.5 or higher |
| Chase Brown | rushing yards | 79.9 | 68.5 or lower | 81.5 or higher |
| Chase Brown | receptions | 3.6 | 2.5 or lower | 4.5 or higher |
| Malik Willis | passing yards | 192.8 | 178.5 or lower | 197.5 or higher |
| Malik Willis | rushing yards | 35.3 | 25.5 or lower | 34.5 or higher |
| Tee Higgins | receptions | 3.7 | 2.5 or lower | 4.5 or higher |
| Tee Higgins | receiving yards | 52.9 | 43.5 or lower | 53.5 or higher |
| Ja'Marr Chase | receptions | 4.1 | 3.5 or lower | 4.5 or higher |
| Ja'Marr Chase | receiving yards | 46.2 | 38.5 or lower | 46.5 or higher |
| Malik Washington | receptions | 4.5 | 3.5 or lower | 5.5 or higher |
| Malik Washington | receiving yards | 43.7 | 36.5 or lower | 44.5 or higher |
Minnesota Vikings at New Orleans Saints: MIN 70%
The model has MIN at 70% against a market price of 54%. What drives it: point margin (+9.5 points), head to head (+2.0 points), recent form (+1.5 points). The case against is defense (-5.0 points). The line is MIN -1.5, total 42.5. That is a 16-point gap to the market, our side is worth a look at the current price.
| MIN | NO | |
|---|---|---|
| Record | 4-0 | 1-3 |
| Margin per game (pts) | +8.8 | -5.8 |
| Home / road | 2-0 | 0-2 |
| Streak | W4 | L2 |
| Last five | 4-0 | 1-3 |
| Rest days | 7 | 6 |
| Head to head | 2 wins | 0 wins |
MIN starter: Kyler Murray. MIN out: Justin Jefferson, Josh Oliver, Brett Thorson, Charles Demmings, Donovan Jackson. NO starter: Tyler Shough. NO out: Zach Wilson, Travis Etienne Jr., Brock Rechsteiner, Jordyn Tyson, Noah Fant.
| Player | Stat | Our projection | Over is a play at | Under is a play at |
|---|---|---|---|---|
| Chris Olave | receptions | 7.5 | 6.5 or lower | 8.5 or higher |
| Chris Olave | receiving yards | 92.9 | 77.5 or lower | 93.5 or higher |
| Tyler Shough | passing yards | 259.7 | 240.5 or lower | 266.5 or higher |
| Tyler Shough | rushing yards | 22.1 | 15.5 or lower | 21.5 or higher |
| Aaron Jones Sr. | rushing yards | 87.7 | 74.5 or lower | 89.5 or higher |
| Aaron Jones Sr. | receptions | 3.4 | 2.5 or lower | 4.5 or higher |
| Kyler Murray | passing yards | 211.8 | 195.5 or lower | 217.5 or higher |
| Kyler Murray | rushing yards | 31 | 22.5 or lower | 30.5 or higher |
| T.J. Hockenson | receptions | 5.9 | 4.5 or lower | 6.5 or higher |
| T.J. Hockenson | receiving yards | 53.7 | 44.5 or lower | 54.5 or higher |
| Devaughn Vele | receptions | 4.4 | 3.5 or lower | 5.5 or higher |
| Devaughn Vele | receiving yards | 52.8 | 43.5 or lower | 53.5 or higher |
Detroit Lions at Arizona Cardinals: DET 68%
The model has DET at 68% against a market price of 66%. What drives it: point margin (+8.3 points), offense (+6.8 points), quarterback (+3.1 points). The case against is home/road split (-0.4 points). The line is DET -4.5, total 54.5.
| DET | ARI | |
|---|---|---|
| Record | 2-2 | 1-3 |
| Margin per game (pts) | -2.0 | -7.5 |
| Home / road | 0-2 | 0-1 |
| Streak | L1 | L3 |
| Last five | 2-2 | 1-3 |
| Rest days | 7 | 7 |
| Head to head | 2 wins | 0 wins |
DET starter: Jared Goff. DET out: Ben Bartch, Brian Branch, Cade Mays, Rock Ya-Sin, Thomas Harper. ARI starter: Jacoby Brissett. ARI out: Dadrion Taylor-Demerson, Paris Johnson Jr..
| Player | Stat | Our projection | Over is a play at | Under is a play at |
|---|---|---|---|---|
| Jahmyr Gibbs | rushing yards | 101.8 | 86.5 or lower | 103.5 or higher |
| Jahmyr Gibbs | receptions | 3.9 | 2.5 or lower | 4.5 or higher |
| Jared Goff | passing yards | 320.7 | 296.5 or lower | 328.5 or higher |
| Jacoby Brissett | passing yards | 290 | 268.5 or lower | 297.5 or higher |
| Jacoby Brissett | rushing yards | 13.5 | 9.5 or lower | 13.5 or higher |
| Michael Wilson | receptions | 7.2 | 6.5 or lower | 8.5 or higher |
| Michael Wilson | receiving yards | 89.2 | 74.5 or lower | 90.5 or higher |
| Trey McBride | receptions | 7.9 | 6.5 or lower | 8.5 or higher |
| Trey McBride | receiving yards | 75.1 | 62.5 or lower | 75.5 or higher |
| Amon-Ra St. Brown | receptions | 6.1 | 5.5 or lower | 6.5 or higher |
| Amon-Ra St. Brown | receiving yards | 71.6 | 59.5 or lower | 72.5 or higher |
Houston Texans at Tennessee Titans: HOU 67%
The model has HOU at 67% against a market price of 73%. What drives it: point margin (+8.3 points), offense (+6.6 points), head to head (+2.5 points). The case against is injuries (hou without dell) (-1.9 points). The line is HOU -7.0, total 38.5. That is a 7-point gap to the market, so the market likes this side more than we do; treat the pick as a lean.
| HOU | TEN | |
|---|---|---|
| Record | 0-4 | 0-4 |
| Margin per game (pts) | -6.2 | -7.0 |
| Home / road | 0-1 | 0-2 |
| Streak | L4 | L4 |
| Last five | 0-4 | 0-4 |
| Rest days | 7 | 7 |
| Head to head | 5 wins | 1 wins |
HOU starter: C.J. Stroud. HOU out: British Brooks, Tank Dell, Azeez Al-Shaair. TEN starter: Cam Ward. TEN out: Fernando Carmona, Jackson Slater.
| Player | Stat | Our projection | Over is a play at | Under is a play at |
|---|---|---|---|---|
| C.J. Stroud | passing yards | 257.5 | 237.5 or lower | 264.5 or higher |
| C.J. Stroud | rushing yards | 15.3 | 10.5 or lower | 15.5 or higher |
| Nico Collins | receptions | 4.8 | 3.5 or lower | 5.5 or higher |
| Nico Collins | receiving yards | 69.8 | 57.5 or lower | 70.5 or higher |
| David Montgomery | rushing yards | 64.3 | 54.5 or lower | 65.5 or higher |
| David Montgomery | receptions | 1.5 | 0.5 or lower | 2.5 or higher |
| Carnell Tate | receptions | 5.1 | 4.5 or lower | 5.5 or higher |
| Carnell Tate | receiving yards | 64.6 | 53.5 or lower | 65.5 or higher |
| Cam Ward | passing yards | 176.4 | 162.5 or lower | 181.5 or higher |
| Cam Ward | rushing yards | 11.3 | 7.5 or lower | 11.5 or higher |
| Tony Pollard | rushing yards | 52 | 44.5 or lower | 53.5 or higher |
| Tony Pollard | receptions | 2.1 | 1.5 or lower | 2.5 or higher |
Cleveland Browns at New York Jets: CLE 62%
The model has CLE at 62% against a market price of 46%. What drives it: injuries (nyj without hall, mitchell) (+6.0 points), venue (+2.4 points), point margin (+2.1 points). The case against is defense (-1.4 points). The line is NYJ -2.5, total 39.5. That is a 16-point gap to the market, our side is worth a look at the current price.
| CLE | NYJ | |
|---|---|---|
| Record | 3-1 | 1-3 |
| Margin per game (pts) | -3.5 | -2.0 |
| Home / road | 1-1 | 0-1 |
| Streak | W3 | L3 |
| Last five | 3-1 | 1-3 |
| Rest days | 10 | 7 |
| Head to head | 1 wins | 2 wins |
CLE starter: Deshaun Watson. CLE out: Tylan Wallace, Elgton Jenkins, Teven Jenkins. NYJ starter: Geno Smith. NYJ out: Breece Hall, Adonai Mitchell, Arian Smith, Mason Taylor, Braiden McGregor.
| Player | Stat | Our projection | Over is a play at | Under is a play at |
|---|---|---|---|---|
| Garrett Wilson | receptions | 7.7 | 6.5 or lower | 8.5 or higher |
| Garrett Wilson | receiving yards | 86.8 | 72.5 or lower | 87.5 or higher |
| Quinshon Judkins | rushing yards | 76.3 | 65.5 or lower | 77.5 or higher |
| Quinshon Judkins | receptions | 3.2 | 2.5 or lower | 3.5 or higher |
| Deshaun Watson | passing yards | 210.3 | 194.5 or lower | 215.5 or higher |
| Deshaun Watson | rushing yards | 29 | 20.5 or lower | 28.5 or higher |
| Geno Smith | passing yards | 210.1 | 194.5 or lower | 215.5 or higher |
| Denzel Boston | receptions | 4.2 | 3.5 or lower | 4.5 or higher |
| Denzel Boston | receiving yards | 66.8 | 55.5 or lower | 67.5 or higher |
| KC Concepcion | receptions | 4.9 | 3.5 or lower | 5.5 or higher |
| KC Concepcion | receiving yards | 54.1 | 44.5 or lower | 54.5 or higher |
Chicago Bears at Green Bay Packers: CHI 62%
The model has CHI at 62% against a market price of 57%. What drives it: point margin (+11.3 points), offense (+6.8 points), injuries (gb without jacobs, reed) (+3.5 points). The case against is defense (-3.3 points). The line is CHI -3.0, total 45.5. That is a 5-point gap to the market, our side is worth a look at the current price.
| CHI | GB | |
|---|---|---|
| Record | 3-1 | 2-2 |
| Margin per game (pts) | +11.8 | -8.0 |
| Home / road | 1-0 | 0-1 |
| Streak | W2 | W1 |
| Last five | 3-1 | 2-2 |
| Rest days | 7 | 7 |
| Head to head | 3 wins | 3 wins |
CHI starter: Tyson Bagent. CHI out: Caleb Williams, Anthony Johnson Jr., Braxton Jones, Cam Lewis, Kyler Gordon. GB starter: Jordan Love. GB out: Josh Jacobs, Jayden Reed, Aaron Banks, Anthony Campbell, Edgerrin Cooper.
| Player | Stat | Our projection | Over is a play at | Under is a play at |
|---|---|---|---|---|
| Christian Watson | receptions | 4.4 | 3.5 or lower | 5.5 or higher |
| Christian Watson | receiving yards | 73.9 | 61.5 or lower | 74.5 or higher |
| D'Andre Swift | rushing yards | 63.9 | 54.5 or lower | 65.5 or higher |
| D'Andre Swift | receptions | 2 | 1.5 or lower | 2.5 or higher |
| Matthew Golden | receptions | 4.4 | 3.5 or lower | 5.5 or higher |
| Matthew Golden | receiving yards | 60.3 | 49.5 or lower | 61.5 or higher |
| Jordan Love | passing yards | 202.2 | 186.5 or lower | 207.5 or higher |
| Tyson Bagent | passing yards | 191.7 | 177.5 or lower | 196.5 or higher |
| Luther Burden III | receptions | 4.2 | 3.5 or lower | 4.5 or higher |
| Luther Burden III | receiving yards | 55.5 | 45.5 or lower | 56.5 or higher |
Denver Broncos at Los Angeles Chargers: DEN 59%
The model has DEN at 59% against a market price of 62%. What drives it: point margin (+5.2 points), recent form (+2.7 points), offense (+1.9 points). The case against is defense (-2.1 points). The line is DEN -3.5, total 42.5. That is a 4-point gap to the market, so the market likes this side more than we do; treat the pick as a lean.
| DEN | LAC | |
|---|---|---|
| Record | 2-2 | 0-4 |
| Margin per game (pts) | -5.0 | -9.8 |
| Home / road | 0-2 | 0-2 |
| Streak | L1 | L4 |
| Last five | 2-2 | 0-4 |
| Rest days | 7 | 7 |
| Head to head | 3 wins | 3 wins |
DEN starter: Bo Nix. DEN out: Jonah Coleman, Pat Bryant, Dondrea Tillman, Jonathon Cooper, Pat Surtain II. LAC starter: Justin Herbert. LAC out: Brenen Thompson, Charlie Kolar, Dalvin Tomlinson, Derwin James Jr., Kayode Awosika.
| Player | Stat | Our projection | Over is a play at | Under is a play at |
|---|---|---|---|---|
| Bo Nix | passing yards | 204.1 | 188.5 or lower | 209.5 or higher |
| Bo Nix | rushing yards | 14.8 | 10.5 or lower | 14.5 or higher |
| Jaylen Waddle | receptions | 4.2 | 3.5 or lower | 4.5 or higher |
| Jaylen Waddle | receiving yards | 57.1 | 47.5 or lower | 57.5 or higher |
| Justin Herbert | passing yards | 157.5 | 145.5 or lower | 161.5 or higher |
| Justin Herbert | rushing yards | 26.6 | 19.5 or lower | 26.5 or higher |
| RJ Harvey | rushing yards | 21.7 | 18.5 or lower | 22.5 or higher |
| RJ Harvey | receptions | 4.1 | 3.5 or lower | 4.5 or higher |
| Omarion Hampton | rushing yards | 46.8 | 39.5 or lower | 47.5 or higher |
| Omarion Hampton | receptions | 1.8 | 0.5 or lower | 2.5 or higher |
| J.K. Dobbins | rushing yards | 57.5 | 48.5 or lower | 58.5 or higher |
Indianapolis Colts at Pittsburgh Steelers: PIT 57%
The model has PIT at 57% against a market price of 55%. What drives it: injuries (pit without dowdle; ind without pierce, allen) (+2.9 points), rest (+0.8 points), venue (+0.8 points). The case against is offense (-5.6 points). The line is PIT -2.5, total 44.5.
| IND | PIT | |
|---|---|---|
| Record | 2-2 | 2-2 |
| Margin per game (pts) | -0.5 | -2.5 |
| Home / road | 1-1 | 2-0 |
| Streak | W2 | L1 |
| Last five | 2-2 | 2-2 |
| Rest days | 7 | 10 |
| Head to head | 2 wins | 2 wins |
IND starter: Daniel Jones. IND out: Alec Pierce, Keenan Allen, Arden Key, Micheal Clemons. PIT starter: Aaron Rodgers. PIT out: Rico Dowdle, Derrick Harmon, Jamel Dean.
| Player | Stat | Our projection | Over is a play at | Under is a play at |
|---|---|---|---|---|
| Jaylen Warren | rushing yards | 84.8 | 72.5 or lower | 86.5 or higher |
| Jaylen Warren | receptions | 3.6 | 2.5 or lower | 4.5 or higher |
| Aaron Rodgers | passing yards | 264.8 | 244.5 or lower | 271.5 or higher |
| Jonathan Taylor | rushing yards | 65.7 | 55.5 or lower | 66.5 or higher |
| Jonathan Taylor | receptions | 2.7 | 1.5 or lower | 3.5 or higher |
| DK Metcalf | receptions | 5.1 | 4.5 or lower | 5.5 or higher |
| DK Metcalf | receiving yards | 71.8 | 59.5 or lower | 72.5 or higher |
| Daniel Jones | passing yards | 192.9 | 178.5 or lower | 197.5 or higher |
| Tyler Warren | receptions | 4.6 | 3.5 or lower | 5.5 or higher |
| Tyler Warren | receiving yards | 44.3 | 36.5 or lower | 44.5 or higher |
San Francisco 49ers at Seattle Seahawks: SEA 55%
The model has SEA at 55% against a market price of 58%. What drives it: third downs (+1.6 points), head to head (+1.3 points), yards margin (+1.3 points). The case against is quarterback (-2.2 points). The line is SEA -3.0, total 47.5. That is a 3-point gap to the market, so the market likes this side more than we do; treat the pick as a lean.
| SF | SEA | |
|---|---|---|
| Record | 4-0 | 3-1 |
| Margin per game (pts) | +14.5 | +8.0 |
| Home / road | 1-0 | 2-0 |
| Streak | W4 | W1 |
| Last five | 4-0 | 3-1 |
| Rest days | 7 | 7 |
| Head to head | 3 wins | 3 wins |
SF starter: Brock Purdy. SF out: Brandon Aiyuk, Christian Kirk, James Thompson Jr., Kyle Juszczyk, Marques Sigle. SEA starter: Sam Darnold. SEA out: Jadarian Price, Zach Charbonnet, Chazz Surratt, Terrion Arnold, Ty Okada.
| Player | Stat | Our projection | Over is a play at | Under is a play at |
|---|---|---|---|---|
| Jaxon Smith-Njigba | receptions | 6.3 | 5.5 or lower | 7.5 or higher |
| Jaxon Smith-Njigba | receiving yards | 89.7 | 74.5 or lower | 90.5 or higher |
| Brock Purdy | passing yards | 191.1 | 176.5 or lower | 196.5 or higher |
| Brock Purdy | rushing yards | 22 | 15.5 or lower | 21.5 or higher |
| Christian McCaffrey | rushing yards | 39.5 | 33.5 or lower | 40.5 or higher |
| Christian McCaffrey | receptions | 4.2 | 3.5 or lower | 4.5 or higher |
| Sam Darnold | passing yards | 202.9 | 187.5 or lower | 208.5 or higher |
| George Kittle | receptions | 4.7 | 3.5 or lower | 5.5 or higher |
| George Kittle | receiving yards | 55.5 | 45.5 or lower | 56.5 or higher |
| Emanuel Wilson | rushing yards | 59.7 | 50.5 or lower | 60.5 or higher |
New York Giants at Washington Commanders: WSH 54%
The model has WSH at 54% against a market price of 60%. What drives it: defense (+4.8 points), head to head (+2.8 points), third downs (+1.2 points). The case against is point margin (-7.4 points). The line is WSH -3.0, total 43.5. That is a 6-point gap to the market, so the market likes this side more than we do; treat the pick as a lean.
| NYG | WSH | |
|---|---|---|
| Record | 3-1 | 1-3 |
| Margin per game (pts) | +0.8 | -8.5 |
| Home / road | 0-1 | 1-1 |
| Streak | W2 | L1 |
| Last five | 3-1 | 1-3 |
| Rest days | 7 | 7 |
| Head to head | 2 wins | 4 wins |
NYG starter: Jameis Winston. NYG out: Braxton Berrios. WSH starter: Athan Kaliakmanis. WSH out: Jayden Daniels, Marcus Mariota, Rachaad White, Jaylin Lane, Terry McLaurin.
| Player | Stat | Our projection | Over is a play at | Under is a play at |
|---|---|---|---|---|
| Athan Kaliakmanis | passing yards | 225.6 | 208.5 or lower | 231.5 or higher |
| Athan Kaliakmanis | rushing yards | 16.8 | 11.5 or lower | 16.5 or higher |
| Jameis Winston | passing yards | 240.5 | 222.5 or lower | 246.5 or higher |
| Isaiah Likely | receptions | 5.9 | 4.5 or lower | 6.5 or higher |
| Isaiah Likely | receiving yards | 61 | 50.5 or lower | 61.5 or higher |
| Jacory Croskey-Merritt | rushing yards | 70.2 | 59.5 or lower | 71.5 or higher |
| Jacory Croskey-Merritt | receiving yards | 10.6 | 7.5 or lower | 10.5 or higher |
| Malik Nabers | receptions | 5 | 3.5 or lower | 5.5 or higher |
| Malik Nabers | receiving yards | 59.4 | 49.5 or lower | 60.5 or higher |
| Stefon Diggs | receptions | 4.6 | 3.5 or lower | 5.5 or higher |
| Stefon Diggs | receiving yards | 52.6 | 43.5 or lower | 53.5 or higher |
Baltimore Ravens at Atlanta Falcons: BAL 54%
The model has BAL at 54% against a market price of 42%. What drives it: offense (+5.1 points), point margin (+5.1 points), quarterback (+3.2 points). The case against is pass rush (-0.8 points). The line is ATL -3.0, total 43.5. That is a 12-point gap to the market, our side is worth a look at the current price.
| BAL | ATL | |
|---|---|---|
| Record | 3-1 | 2-2 |
| Margin per game (pts) | +5.0 | +1.0 |
| Home / road | 2-0 | 0-1 |
| Streak | W2 | W2 |
| Last five | 3-1 | 2-2 |
| Rest days | 7 | 6 |
| Head to head | 1 wins | 0 wins |
BAL starter: Lamar Jackson. BAL out: Chris Moore, Ethan Pocic, Jovaughn Gwyn, Trey Hendrickson. ATL starter: Michael Penix Jr.. ATL out: Cooper Rush, Jack Strand, Ethan Onianwa, James Pearce Jr., Jared Ivey.
| Player | Stat | Our projection | Over is a play at | Under is a play at |
|---|---|---|---|---|
| Lamar Jackson | passing yards | 234.8 | 216.5 or lower | 240.5 or higher |
| Lamar Jackson | rushing yards | 31 | 22.5 or lower | 30.5 or higher |
| Bijan Robinson | rushing yards | 66.2 | 56.5 or lower | 67.5 or higher |
| Bijan Robinson | receptions | 3.9 | 2.5 or lower | 4.5 or higher |
| Zay Flowers | receptions | 5.6 | 4.5 or lower | 6.5 or higher |
| Zay Flowers | receiving yards | 82.1 | 68.5 or lower | 82.5 or higher |
| Drake London | receptions | 5.2 | 4.5 or lower | 5.5 or higher |
| Drake London | receiving yards | 76.6 | 63.5 or lower | 77.5 or higher |
| Derrick Henry | rushing yards | 75.7 | 64.5 or lower | 77.5 or higher |
| Derrick Henry | receiving yards | 11.1 | 8.5 or lower | 11.5 or higher |
| Michael Penix Jr. | passing yards | 218.3 | 201.5 or lower | 223.5 or higher |
Las Vegas Raiders at New England Patriots: NE 53%
The model has NE at 53% against a market price of 63%. What drives it: point margin (+3.7 points), yards margin (+2.4 points), efficiency (epa) (+1.0 points). The case against is defense (-3.5 points). The line is NE -3.5, total 45.5. That is a 10-point gap to the market, so the market likes this side more than we do; treat the pick as a lean.
| LV | NE | |
|---|---|---|
| Record | 3-1 | 2-2 |
| Margin per game (pts) | +7.8 | -3.0 |
| Home / road | 2-0 | 1-0 |
| Streak | L1 | W1 |
| Last five | 3-1 | 2-2 |
| Rest days | 7 | 7 |
| Head to head | 3 wins | 0 wins |
LV starter: Kirk Cousins. LV out: Dont'e Thornton Jr., Jack Bech, Jackson Powers-Johnson. NE starter: Drake Maye. NE out: A.J. Brown, Channing Canada, Christian Barmore, Christian Gonzalez, Greg Van Roten.
| Player | Stat | Our projection | Over is a play at | Under is a play at |
|---|---|---|---|---|
| Drake Maye | passing yards | 241.9 | 223.5 or lower | 248.5 or higher |
| Drake Maye | rushing yards | 33.1 | 23.5 or lower | 32.5 or higher |
| Brock Bowers | receptions | 6.2 | 5.5 or lower | 6.5 or higher |
| Brock Bowers | receiving yards | 69.5 | 57.5 or lower | 70.5 or higher |
| Ashton Jeanty | rushing yards | 60.3 | 51.5 or lower | 61.5 or higher |
| Ashton Jeanty | receptions | 4.4 | 3.5 or lower | 5.5 or higher |
| Kirk Cousins | passing yards | 236.1 | 218.5 or lower | 242.5 or higher |
| Rhamondre Stevenson | rushing yards | 51.1 | 43.5 or lower | 52.5 or higher |
| Rhamondre Stevenson | receptions | 2.8 | 1.5 or lower | 3.5 or higher |
| Tre Tucker | receptions | 4.3 | 3.5 or lower | 4.5 or higher |
| Tre Tucker | receiving yards | 54.2 | 44.5 or lower | 54.5 or higher |
Buffalo Bills at Los Angeles Rams: LAR 50.4%
The model has LAR at 50.4% against a market price of 57%. What drives it: third downs (+1.1 points), yards margin (+0.9 points), head to head (+0.8 points). The case against is offense (-5.2 points). The line is LAR -2.5, total 54.5. That is a 7-point gap to the market, so the market likes this side more than we do; treat the pick as a lean.
| BUF | LAR | |
|---|---|---|
| Record | 3-1 | 2-2 |
| Margin per game (pts) | +5.0 | +0.5 |
| Home / road | 1-0 | 1-1 |
| Streak | L1 | W1 |
| Last five | 3-1 | 2-2 |
| Rest days | 8 | 8 |
| Head to head | 1 wins | 1 wins |
BUF starter: Josh Allen. BUF out: Christian Benford, T.J. Sanders. LAR starter: Matthew Stafford. LAR out: Colby Parkinson, Terrance Ferguson, Aaron Donald, Jaylen Watson, Myles Garrett.
| Player | Stat | Our projection | Over is a play at | Under is a play at |
|---|---|---|---|---|
| Josh Allen | passing yards | 232.3 | 214.5 or lower | 238.5 or higher |
| Josh Allen | rushing yards | 32.5 | 23.5 or lower | 31.5 or higher |
| Matthew Stafford | passing yards | 293.3 | 271.5 or lower | 300.5 or higher |
| Kyren Williams | rushing yards | 75.5 | 64.5 or lower | 76.5 or higher |
| Kyren Williams | receptions | 3.4 | 2.5 or lower | 4.5 or higher |
| Puka Nacua | receptions | 6.7 | 5.5 or lower | 7.5 or higher |
| Puka Nacua | receiving yards | 89.8 | 74.5 or lower | 90.5 or higher |
| Davante Adams | receptions | 4.4 | 3.5 or lower | 5.5 or higher |
| Davante Adams | receiving yards | 63.2 | 52.5 or lower | 63.5 or higher |
| James Cook III | rushing yards | 77.7 | 66.5 or lower | 79.5 or higher |
| James Cook III | receptions | 1.7 | 0.5 or lower | 2.5 or higher |
Anytime touchdown list
| Player | Team | Expected | Our probability | Fair price | Take at |
|---|---|---|---|---|---|
| Jahmyr Gibbs | DET | 1.44 | 76% | -322 | -263 |
| Javonte Williams | DAL | 1.10 | 67% | -200 | -173 |
| Kyren Williams | LAR | 1.08 | 66% | -194 | -168 |
| Jaxon Smith-Njigba | SEA | 0.97 | 62% | -164 | -144 |
| Jonathan Taylor | IND | 0.84 | 57% | -131 | -117 |
| Derrick Henry | BAL | 0.81 | 56% | -125 | -112 |
| Josh Allen | BUF | 0.75 | 53% | -112 | -101 |
| Bijan Robinson | ATL | 0.74 | 52% | -110 | +101 |
| Christian Watson | GB | 0.73 | 52% | -107 | +103 |
| Chase Brown | CIN | 0.68 | 49% | +103 | +114 |
| Davante Adams | LAR | 0.68 | 49% | +103 | +114 |
| Amon-Ra St. Brown | DET | 0.67 | 49% | +105 | +116 |
Last week's board
16 games, the model went 11-5.
| Date | Game | Pick | Verdexed | Model alone | Market | Final | Result | Card |
|---|---|---|---|---|---|---|---|---|
| October 1 | PIT at CLE | PIT | 50.0% | 47% | 57% | CLE 27-24 | Miss | PIT -148 (miss) |
| October 4 | MIA at MIN | MIN | 82% | 83% | 81% | MIN 15-10 | Hit | MIN -520 (hit) |
| October 4 | TEN at BAL | BAL | 81% | 79% | 85% | BAL 24-18 | Hit | BAL -700 (hit) |
| October 4 | LAC at SEA | SEA | 76% | 76% | 75% | SEA 30-23 | Hit | SEA -375 (hit) |
| October 4 | NE at BUF | BUF | 72% | 71% | 73% | NE 29-26 | Miss | BUF -310 (miss) |
| October 4 | NYJ at CHI | CHI | 66% | 76% | 62% | CHI 23-12 | Hit | CHI -185 (hit) |
| October 4 | DET at CAR | DET | 63% | 63% | 64% | CAR 32-26 | Miss | DET -180 (miss) |
| October 4 | DEN at SF | SF | 62% | 63% | 59% | SF 24-14 | Hit | SF -148 (hit) |
| October 4 | KC at LV | KC | 59% | 56% | 66% | KC 30-27 | Hit | - |
| October 4 | GB at TB | GB | 59% | 53% | 61% | GB 17-14 | Hit | - |
| October 4 | IND at WSH | IND | 58% | 42% | 66% | IND 30-13 | Hit | - |
| October 4 | LAR at PHI | LAR | 57% | 55% | 64% | LAR 24-20 | Hit | - |
| October 4 | DAL at HOU | HOU | 56% | 56% | 57% | DAL 34-30 | Miss | - |
| October 4 | JAX at CIN | JAX | 51% | 54% | 43% | JAX 22-17 | Hit | - |
| October 4 | ARI at NYG | ARI | 51% | 40% | 55% | NYG 36-24 | Miss | - |
| October 5 | ATL at NO | ATL | 52% | 60% | 48% | ATL 45-24 | Hit | ATL +110 (hit) |
Where the model and the market split: IND at WSH: the model took WSH (58%), the market IND; the served pick was IND and the pick hit. ARI at NYG: the model took NYG (60%), the market ARI; the served pick was ARI and the pick missed. ATL at NO: the model took ATL (60%), the market NO; the served pick was ATL and the pick hit. JAX at CIN: the model took JAX (54%), the market CIN; the served pick was JAX and the pick hit. PIT at CLE: the model took CLE (53%), the market PIT; the served pick was PIT and the pick missed. CHI over NYJ: model 76%, market 62%, a 14-point gap; the pick hit.
The firmest calls: MIN 82% over MIA (hit), BAL 81% over TEN (hit), SEA 76% over LAC (hit).
The Model Card is a different question from the pick: the pick is the more likely winner, the card leg is the side whose price beats the model's own number. The card went 6-3 on its 9 legs here.
Season to date through October 5: 39-24 (61.9%), Brier 0.227; picks at 60% or better are 22-11.
The record
Graded regular-season picks since 2026-09-01: 39 of 63 (61.9%), Brier score 0.227. The live figure, the hit rate by confidence band and every voided pick with its reason are on the NFL accuracy page.
How it landed
1 game, the model went 0-1.
| Date | Game | Pick | Verdexed | Model alone | Market | Final | Result | Card |
|---|---|---|---|---|---|---|---|---|
| October 8 | TB at DAL | DAL | 71% | 53% | 79% | TB 24-16 | Miss | DAL -500 (miss) |
Where the model and the market split: DAL over TB: model 53%, market 79%, a 26-point gap; the pick missed.
The firmest calls: DAL 71% over TB (miss).
The Model Card is a different question from the pick: the pick is the more likely winner, the card leg is the side whose price beats the model's own number. The card went 0-1 on its 1 leg here.
Season to date through October 8: 39-25 (60.9%), Brier 0.231; picks at 60% or better are 22-12.
Responsible play
This is model output, not betting advice. Verdexed publishes its model's probabilities and edges for informational and entertainment purposes only. Nothing here is a recommendation to place a wager, and no outcome is guaranteed, even the model's highest-confidence picks lose regularly.
You must be of legal betting age in your jurisdiction and located where sports wagering is legal to bet. Sports betting is not available everywhere; know and follow the laws where you are. Never bet more than you can afford to lose, and never chase losses.
If gambling is affecting you or someone you know, help is available. In the US, call or text 1-800-GAMBLER (1-800-426-2537), or visit ncpgambling.org. Please play responsibly.