 NFL2026-11-22
NFL Week 11 Sunday Best Bets: BUF 85%, KC 85% and 5 More
By Verdexed Analytics
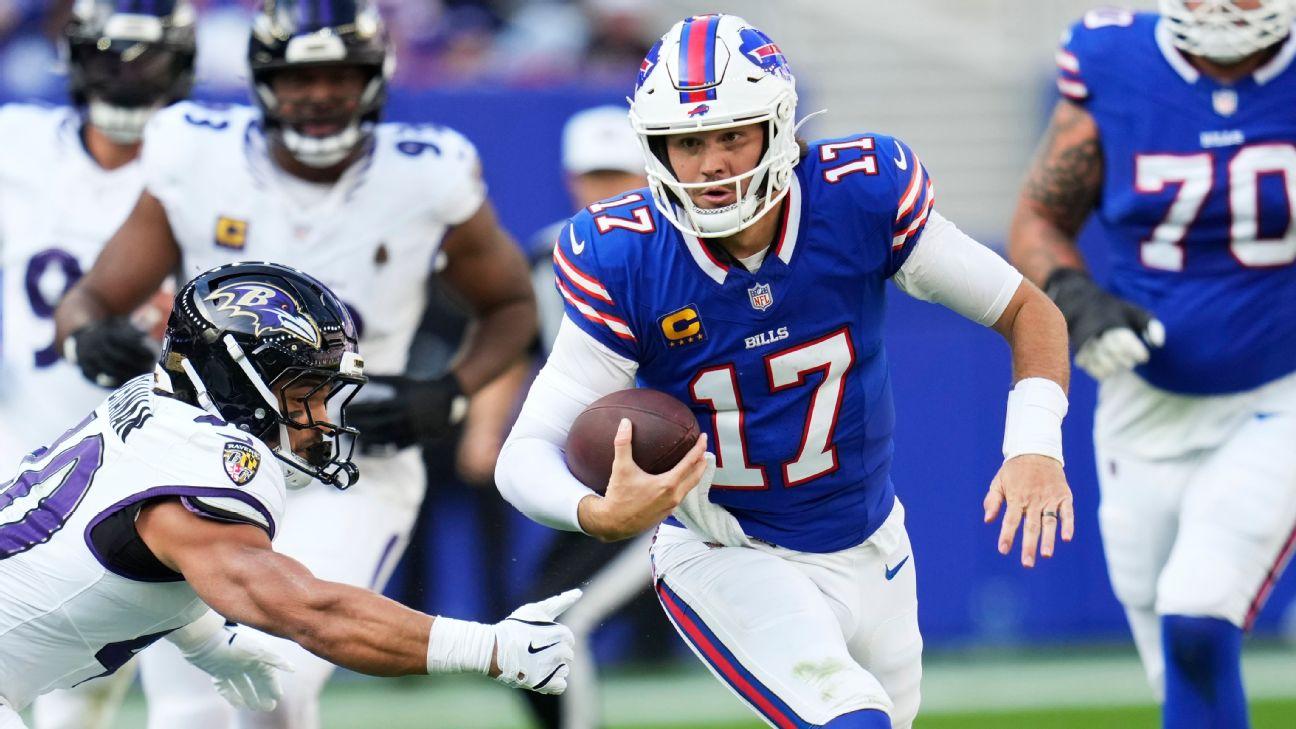
11 games on the Week 11 Sunday slate, rebuilt this morning on the final injury reports and the lines as they stand. The firmest call is BUF at 85% over MIA; the model and the market are 3 points or more apart on 5. The NFL Model Card has 7 picks to win and 5 props. Season to date the model is 96-53 (64.4%) on graded picks.
Every number here is the model's own: win probabilities from the point-in-time model blended with the market, the drivers from its feature breakdown, the player lines from the same projections that build the DFS slates. A player line is the point where our distribution gives that side 57%: the over is a play at that line or lower, the under at that line or higher, at -120 or better.
The Sunday board
Early window
| Kickoff | Game | Pick | Verdexed | Market | Edge (pts) | Pick price | Line | Total | Card |
|---|---|---|---|---|---|---|---|---|---|
| 1:00 PM ET | MIA at BUF | BUF | 85% | 90% | -5 | -1460 | BUF -16.5 | 44.5 | LockBUF |
| 1:00 PM ET | ARI at KC | KC | 85% | 89% | -4 | -1320 | KC -15.5 | 40.5 | LockKC |
| 1:00 PM ET | NO at CHI | CHI | 78% | 83% | -5 | -610 | CHI -11.5 | 48.5 | LockCHI |
| 1:00 PM ET | TEN at DAL | DAL | 72% | 74% | -2 | -343 | DAL -7.5 | 54.5 | LockDAL |
| 1:00 PM ET | PIT at PHI | PIT | 65% | 63% | +2 | -190 | PIT -3.5 | 37.5 | LockPIT |
| 1:00 PM ET | TB at DET | DET | 61% | 64% | -3 | -200 | DET -3.5 | 47.5 | - |
| 1:00 PM ET | BAL at CAR | CAR | 58% | 57% | +1 | -145 | CAR -3.0 | 43.5 | - |
Late window
| Kickoff | Game | Pick | Verdexed | Market | Edge (pts) | Pick price | Line | Total | Card |
|---|---|---|---|---|---|---|---|---|---|
| 4:05 PM ET | NYJ at LAC | LAC | 57% | 61% | -4 | -172 | LAC -3.0 | 41.5 | - |
| 4:25 PM ET | LV at DEN | DEN | 84% | 82% | +2 | -610 | DEN -10.5 | 41.5 | LockDEN |
| 4:25 PM ET | JAX at NYG | JAX | 70% | 69% | +1 | -255 | JAX -6.0 | 45.5 | LockJAX |
Sunday night
| Kickoff | Game | Pick | Verdexed | Market | Edge (pts) | Pick price | Line | Total | Card |
|---|---|---|---|---|---|---|---|---|---|
| 8:20 PM ET | MIN at SF | SF | 63% | 62% | +1 | -178 | SF -3.5 | 46.5 | - |
The pick is the more likely winner. The Card column is the game's leg on the NFL Model Card, with its call: Lock is 65% or better on our number, Play 58% or better, Lean anything the card still takes. Edge is our number minus the market's, in points.
The Model Card
| Game | Call | Pick | Our number | Price | Market | Edge | Why |
|---|---|---|---|---|---|---|---|
| MIA at BUF | Lock | BUF | 85% | -1460 | 90% | -5 | EPA per play +15.1, point margin +7.7 |
| ARI at KC | Lock | KC | 85% | -1320 | 89% | -4 | EPA per play +15.4, point margin +7.9 |
| LV at DEN | Lock | DEN | 85% | -610 | 83% | +2 | EPA per play +12.7, point margin +3.6 |
| NO at CHI | Lock | CHI | 78% | -610 | 83% | -5 | EPA per play +10.6, point margin +7.9 |
| TEN at DAL | Lock | DAL | 72% | -343 | 74% | -2 | EPA per play +15.2, point margin +7.9 |
| JAX at NYG | Lock | JAX | 70% | -255 | 69% | +1 | EPA per play +20.2, point margin +11.1 |
| PIT at PHI | Lock | PIT | 65% | -190 | 63% | +2 | point margin +10.0, EPA per play +7.6 |
The card stays live until kickoff: each leg locks at its own game's start at the price then on offer, and is graded in public on the Model Cards page.
Why each pick
Buffalo Bills over Miami Dolphins, 85%, -1460. Lock on the NFL card. What drives it: EPA per play (+15.1 points), point margin (+7.7 points), offense (+4.0 points). The case against is injuries (BUF without Kincaid, Benford, Williams; MIA without Trader, Phillips, Simpson; Baker day-to-day) (-2.7 points). The market is 5 points firmer on it than we are; we still have BUF as the more likely winner. The line BUF -16.5, total 44.5. MIA starter: Kyle McCord. MIA out: Jared Wayne, Bradley Pinion, Dante Trader Jr., Jaylin Simpson, Jordan Phillips. BUF starter: Josh Allen. BUF out: Dalton Kincaid, Ar'maj Reed-Adams, Christian Benford, Dorian Williams.
Kansas City Chiefs over Arizona Cardinals, 85%, -1320. Lock on the NFL card. What drives it: EPA per play (+15.4 points), point margin (+7.9 points), offense (+3.1 points). The case against is injuries (KC without Walker; ARI without Wingard, Conner, Carter) (-2.9 points). The market is 4 points firmer on it than we are; we still have KC as the more likely winner. The line KC -15.5, total 40.5. ARI starter: Josh Johnson. ARI out: Carson Beck, Gardner Minshew II, James Conner, Jalen Brooks, Andrew Wingard. KC starter: Patrick Mahomes. KC out: Kenneth Walker III, Jared Wiley, Jaylon Moore, Trey Smith. Crew: Brad Allen has been tough on KC (2-3 in 5 games with this referee, a win rate 18 points below its norm under others).
Denver Broncos over Las Vegas Raiders, 85%, -610. Lock on the NFL card. What drives it: EPA per play (+12.7 points), point margin (+3.6 points), recent form (+2.0 points). The case against is defense (-1.5 points). The line DEN -10.5, total 41.5. LV starter: Fernando Mendoza. LV out: Tonka Hemingway. DEN starter: Bo Nix. DEN out: Caleb Lohner. Crew: Carl Cheffers has been friendly to DEN (5-1 in 6 games with this referee, a win rate 18 points above its norm under others).
Chicago Bears over New Orleans Saints, 78%, -610. Lock on the NFL card. What drives it: EPA per play (+10.6 points), point margin (+7.9 points), yards margin (+3.6 points). The case against is defense (-1.7 points). The market is 5 points firmer on it than we are; we still have CHI as the more likely winner. The line CHI -11.5, total 48.5. NO starter: Tyler Shough. NO out: Asim Richards, Christen Miller, Erik McCoy, Martin Emerson Jr., Taliese Fuaga. CHI starter: Caleb Williams. CHI out: Zavier Scott, Kyler Gordon. Crew: Brad Rogers has been tough on CHI (+1.2 flags a game versus its norm, 2-4 in 6 games). Crew: Brad Rogers has been friendly to NO (-1.1 flags a game versus its norm, 1-5 in 6 games).
Dallas Cowboys over Tennessee Titans, 72%, -343. Lock on the NFL card. What drives it: EPA per play (+15.2 points), point margin (+7.9 points), offense (+5.4 points). The case against is efficiency (EPA) (-3.1 points). The line DAL -7.5, total 54.5. TEN starter: Cam Ward. TEN out: Tyjae Spears, Wan'Dale Robinson, Fernando Carmona, Jaylen Harrell. DAL starter: Dak Prescott. DAL out: Jonathan Mingo, Jake Ferguson, DaRon Bland, Jalen Thompson, P.J. Locke.
Jacksonville Jaguars over New York Giants, 70%, -255. Lock on the NFL card. What drives it: EPA per play (+20.2 points), point margin (+11.1 points), offense (+4.5 points). The case against is defense (-1.9 points). The line JAX -6.0, total 45.5. JAX starter: Trevor Lawrence. JAX out: B.J. Green II, Danny Striggow, Robert Hainsey. NYG starter: J.J. McCarthy. NYG out: Tyrone Tracy Jr. Crew: Craig Wrolstad has been friendly to JAX (-1.7 flags a game versus its norm, 4-1 in 5 games).
Pittsburgh Steelers over Philadelphia Eagles, 65%, -190. Lock on the NFL card. What drives it: point margin (+10.0 points), EPA per play (+7.6 points), recent form (+5.3 points). The case against is rest (-3.1 points). The line PIT -3.5, total 37.5. PIT starter: Aaron Rodgers. PIT out: Michael Pittman Jr., Gennings Dunker, Mason McCormick, Nick Herbig. PHI starter: Joe Milton. PHI out: Tank Bigsby, Dontayvion Wicks, Smael Mondon Jr., Zack Baun.
The props card
| Player | Call | Team | Game | Prop | Our projection | Our probability |
|---|---|---|---|---|---|---|
| Josh Allen | Lean | BUF | MIA at BUF | Over 201.5 passing yards | 232.3 | 66% |
| Patrick Mahomes | Lean | KC | ARI at KC | Over 247.5 passing yards | 285 | 65% |
| Jahmyr Gibbs | Lean | DET | TB at DET | Over 66.5 rushing yards | 85.8 | 65% |
| James Cook III | Lean | BUF | MIA at BUF | Over 81.5 rushing yards | 105 | 65% |
| Dak Prescott | Lean | DAL | TEN at DAL | Over 259.5 passing yards | 297.9 | 65% |
Each prop is the half-point line where our distribution gives the over at least 65%; Lock is 80% or better, Play 70% or better. Props carry no market price here, so take a leg at -120 or better.
The tickets
| League | Ticket | Legs | Pays | Our probability | Fair |
|---|---|---|---|---|---|
| NFL | Games | BUF; KC; DEN; CHI; DAL; JAX; PIT | +327 | 16% | +537 |
| NFL | Props | Josh Allen over 201.5 passing yards; Patrick Mahomes over 247.5 passing yards; Jahmyr Gibbs over 66.5 rushing yards; James Cook III over 81.5 rushing yards; Dak Prescott over 259.5 passing yards | +743 (fair) | 12% | +743 |
| NFL | Best of both | BUF; KC; DEN; Jahmyr Gibbs over 66.5 rushing yards; James Cook III over 81.5 rushing yards; Dak Prescott over 259.5 passing yards | +385 | 17% | +492 |
The whole game card as one parlay at its locked lines, the props card at fair odds, and the best of both. Our probability is the product of the legs; Fair is the price that probability deserves.
Where we differ from the market
The market is more confident than we are on these. We still expect the favourite to win; on our numbers the price is a little rich.
| Game | League | Our side | Verdexed | Market | Gap |
|---|---|---|---|---|---|
| MIA at BUF | NFL | BUF | 85% | 90% | -5 |
| NO at CHI | NFL | CHI | 78% | 83% | -5 |
| ARI at KC | NFL | KC | 85% | 89% | -4 |
| NYJ at LAC | NFL | LAC | 57% | 61% | -4 |
| TB at DET | NFL | DET | 61% | 64% | -3 |
Injuries that move the number
Who is out is priced, not counted: every absent skill player is valued by his own production above the next man up. These are the absences that move a game by 0.4 points or more.
| Game | League | Who is out | Effect |
|---|---|---|---|
| ARI at KC | NFL | KC without Walker; ARI without Wingard, Conner, Carter | 2.9 pts against KC |
| MIA at BUF | NFL | BUF without Kincaid, Benford, Williams; MIA without Trader, Phillips, Simpson; Baker day-to-day | 2.7 pts against BUF |
| TEN at DAL | NFL | DAL without Bland, Thompson, Ferguson; Barham day-to-day; TEN without Robinson, Spears; Tate day-to-day | 2.5 pts toward DAL |
| TB at DET | NFL | DET without Hutchinson, Harper; Reed day-to-day; TB without Winfield, McMillan; Diaby day-to-day | 2.1 pts toward DET |
| LV at DEN | NFL | DEN: Jones day-to-day; LV: Bowers day-to-day | 1.8 pts toward DEN |
| JAX at NYG | NFL | NYG without Tracy | 1.2 pts toward JAX |
| NYJ at LAC | NFL | LAC without Henley; Still, McConkey day-to-day; NYJ without Cooper; Ossai day-to-day | 1.0 pts against LAC |
| PIT at PHI | NFL | PHI without Baun, Wicks; PIT without Pittman; Queen, Elliott day-to-day | 0.9 pts toward PIT |
| BAL at CAR | NFL | CAR without Okereke; Waller, Tremble day-to-day; BAL without Humphrey, Hawkins, Madubuike | 0.8 pts against CAR |
| MIN at SF | NFL | SF without Aiyuk; Greenlaw, Evans day-to-day; MIN without Addison; Rodgers day-to-day | 0.6 pts toward SF |
Game by game
Miami Dolphins at Buffalo Bills: BUF 85%
The model has BUF at 85% against a market price of 90%. What drives it: EPA per play (+15.1 points), point margin (+7.7 points), offense (+4.0 points). The case against is injuries (BUF without Kincaid, Benford, Williams; MIA without Trader, Phillips, Simpson; Baker day-to-day) (-2.7 points). The line is BUF -16.5, total 44.5. That is a 5-point gap to the market, so the market likes this side even more than we do: BUF is still the more likely winner, but on our numbers the price is rich.
| MIA | BUF | |
|---|---|---|
| Record | 1-8 | 8-1 |
| Margin per game (pts) | -8.4 | +9.8 |
| Home / road | 1-4 | 3-1 |
| Streak | L3 | W5 |
| Last five | 1-4 | 5-0 |
| Rest days | 7 | 7 |
| Head to head | 1 win | 5 wins |
MIA starter: Kyle McCord. MIA out: Jared Wayne, Bradley Pinion, Dante Trader Jr., Jaylin Simpson, Jordan Phillips. BUF starter: Josh Allen. BUF out: Dalton Kincaid, Ar'maj Reed-Adams, Christian Benford, Dorian Williams.
| Player | Stat | Our projection | Over is a play at | Under is a play at |
|---|---|---|---|---|
| Josh Allen | passing yards | 232.3 | 214.5 or lower | 238.5 or higher |
| Josh Allen | rushing yards | 30.5 | 21.5 or lower | 29.5 or higher |
| James Cook III | rushing yards | 105 | 89.5 or lower | 106.5 or higher |
| James Cook III | receptions | 1.7 | 0.5 or lower | 2.5 or higher |
| Caleb Douglas | receptions | 3.8 | 2.5 or lower | 4.5 or higher |
| Caleb Douglas | receiving yards | 54 | 44.5 or lower | 54.5 or higher |
| Malik Washington | receptions | 3.9 | 2.5 or lower | 4.5 or higher |
| Malik Washington | receiving yards | 38.6 | 31.5 or lower | 39.5 or higher |
| DJ Moore | receptions | 3.4 | 2.5 or lower | 4.5 or higher |
| DJ Moore | receiving yards | 47.6 | 39.5 or lower | 48.5 or higher |
| Ollie Gordon II | rushing yards | 52.5 | 44.5 or lower | 53.5 or higher |
| Ollie Gordon II | receptions | 1.9 | 0.5 or lower | 2.5 or higher |
Arizona Cardinals at Kansas City Chiefs: KC 85%
The model has KC at 85% against a market price of 89%. What drives it: EPA per play (+15.4 points), point margin (+7.9 points), offense (+3.1 points). The case against is injuries (KC without Walker; ARI without Wingard, Conner, Carter) (-2.9 points). The line is KC -15.5, total 40.5. That is a 4-point gap to the market, so the market likes this side even more than we do: KC is still the more likely winner, but on our numbers the price is rich.
| ARI | KC | |
|---|---|---|
| Record | 3-7 | 7-2 |
| Margin per game (pts) | -10.5 | +9.0 |
| Home / road | 3-3 | 4-0 |
| Streak | L2 | W2 |
| Last five | 2-3 | 3-2 |
| Rest days | 7 | 7 |
| Head to head | 0 wins | 1 win |
ARI starter: Josh Johnson. ARI out: Carson Beck, Gardner Minshew II, James Conner, Jalen Brooks, Andrew Wingard. KC starter: Patrick Mahomes. KC out: Kenneth Walker III, Jared Wiley, Jaylon Moore, Trey Smith. Crew: Brad Allen has been tough on KC (2-3 in 5 games with this referee, a win rate 18 points below its norm under others).
| Player | Stat | Our projection | Over is a play at | Under is a play at |
|---|---|---|---|---|
| Patrick Mahomes | passing yards | 285 | 263.5 or lower | 292.5 or higher |
| Patrick Mahomes | rushing yards | 14.3 | 10.5 or lower | 14.5 or higher |
| Trey McBride | receptions | 7 | 5.5 or lower | 7.5 or higher |
| Trey McBride | receiving yards | 64.3 | 53.5 or lower | 65.5 or higher |
| Emmett Johnson | rushing yards | 66.2 | 56.5 or lower | 67.5 or higher |
| Emmett Johnson | receptions | 2.9 | 1.5 or lower | 3.5 or higher |
| Rashee Rice | receptions | 4.7 | 3.5 or lower | 5.5 or higher |
| Rashee Rice | receiving yards | 53.1 | 43.5 or lower | 53.5 or higher |
| Travis Kelce | receptions | 4.1 | 3.5 or lower | 4.5 or higher |
| Travis Kelce | receiving yards | 48.9 | 40.5 or lower | 49.5 or higher |
| Josh Downs | receptions | 3.9 | 2.5 or lower | 4.5 or higher |
| Josh Downs | receiving yards | 42.6 | 35.5 or lower | 43.5 or higher |
New Orleans Saints at Chicago Bears: CHI 78%
The model has CHI at 78% against a market price of 83%. What drives it: EPA per play (+10.6 points), point margin (+7.9 points), yards margin (+3.6 points). The case against is defense (-1.7 points). The line is CHI -11.5, total 48.5. That is a 5-point gap to the market, so the market likes this side even more than we do: CHI is still the more likely winner, but on our numbers the price is rich.
| NO | CHI | |
|---|---|---|
| Record | 3-6 | 7-2 |
| Margin per game (pts) | -3.8 | +6.3 |
| Home / road | 2-1 | 4-1 |
| Streak | L1 | W4 |
| Last five | 2-3 | 4-1 |
| Rest days | 7 | 14 |
| Head to head | 1 win | 1 win |
NO starter: Tyler Shough. NO out: Asim Richards, Christen Miller, Erik McCoy, Martin Emerson Jr., Taliese Fuaga. CHI starter: Caleb Williams. CHI out: Zavier Scott, Kyler Gordon. Crew: Brad Rogers has been tough on CHI (+1.2 flags a game versus its norm, 2-4 in 6 games). Crew: Brad Rogers has been friendly to NO (-1.1 flags a game versus its norm, 1-5 in 6 games).
| Player | Stat | Our projection | Over is a play at | Under is a play at |
|---|---|---|---|---|
| Caleb Williams | passing yards | 258.8 | 239.5 or lower | 265.5 or higher |
| Caleb Williams | rushing yards | 19.8 | 14.5 or lower | 19.5 or higher |
| D'Andre Swift | rushing yards | 68 | 57.5 or lower | 69.5 or higher |
| D'Andre Swift | receptions | 2.6 | 1.5 or lower | 3.5 or higher |
| Luther Burden III | receptions | 5 | 3.5 or lower | 5.5 or higher |
| Luther Burden III | receiving yards | 65.6 | 54.5 or lower | 66.5 or higher |
| Chris Olave | receptions | 5.4 | 4.5 or lower | 6.5 or higher |
| Chris Olave | receiving yards | 69.2 | 57.5 or lower | 69.5 or higher |
| Tyler Shough | passing yards | 211.1 | 194.5 or lower | 216.5 or higher |
| Tyler Shough | rushing yards | 19.4 | 13.5 or lower | 19.5 or higher |
| Colston Loveland | receptions | 4.8 | 3.5 or lower | 5.5 or higher |
| Colston Loveland | receiving yards | 52.7 | 43.5 or lower | 53.5 or higher |
Tennessee Titans at Dallas Cowboys: DAL 72%
The model has DAL at 72% against a market price of 74%. What drives it: EPA per play (+15.2 points), point margin (+7.9 points), offense (+5.4 points). The case against is efficiency (EPA) (-3.1 points). The line is DAL -7.5, total 54.5.
| TEN | DAL | |
|---|---|---|
| Record | 1-8 | 4-6 |
| Margin per game (pts) | -8.0 | +0.4 |
| Home / road | 1-3 | 1-4 |
| Streak | L3 | L1 |
| Last five | 1-4 | 2-3 |
| Rest days | 7 | 7 |
| Head to head | 0 wins | 1 win |
TEN starter: Cam Ward. TEN out: Tyjae Spears, Wan'Dale Robinson, Fernando Carmona, Jaylen Harrell. DAL starter: Dak Prescott. DAL out: Jonathan Mingo, Jake Ferguson, DaRon Bland, Jalen Thompson, P.J. Locke.
| Player | Stat | Our projection | Over is a play at | Under is a play at |
|---|---|---|---|---|
| Dak Prescott | passing yards | 297.9 | 275.5 or lower | 305.5 or higher |
| Tony Pollard | rushing yards | 82.2 | 70.5 or lower | 83.5 or higher |
| Tony Pollard | receptions | 3.4 | 2.5 or lower | 4.5 or higher |
| CeeDee Lamb | receptions | 7.4 | 6.5 or lower | 8.5 or higher |
| CeeDee Lamb | receiving yards | 94.3 | 78.5 or lower | 95.5 or higher |
| Carnell Tate | receptions | 6.4 | 5.5 or lower | 7.5 or higher |
| Carnell Tate | receiving yards | 79 | 65.5 or lower | 79.5 or higher |
| Cam Ward | passing yards | 249.9 | 230.5 or lower | 256.5 or higher |
| Cam Ward | rushing yards | 17.2 | 12.5 or lower | 17.5 or higher |
| George Pickens | receptions | 5.5 | 4.5 or lower | 6.5 or higher |
| George Pickens | receiving yards | 74.3 | 61.5 or lower | 75.5 or higher |
Pittsburgh Steelers at Philadelphia Eagles: PIT 65%
The model has PIT at 65% against a market price of 63%. What drives it: point margin (+10.0 points), EPA per play (+7.6 points), recent form (+5.3 points). The case against is rest (-3.1 points). The line is PIT -3.5, total 37.5.
| PIT | PHI | |
|---|---|---|
| Record | 6-3 | 2-7 |
| Margin per game (pts) | +1.8 | -8.1 |
| Home / road | 2-3 | 1-4 |
| Streak | L1 | L7 |
| Last five | 4-1 | 0-5 |
| Rest days | 7 | 14 |
| Head to head | 0 wins | 2 wins |
PIT starter: Aaron Rodgers. PIT out: Michael Pittman Jr., Gennings Dunker, Mason McCormick, Nick Herbig. PHI starter: Joe Milton. PHI out: Tank Bigsby, Dontayvion Wicks, Smael Mondon Jr., Zack Baun.
| Player | Stat | Our projection | Over is a play at | Under is a play at |
|---|---|---|---|---|
| Joe Milton | passing yards | 190.3 | 175.5 or lower | 195.5 or higher |
| Joe Milton | rushing yards | 35.2 | 25.5 or lower | 34.5 or higher |
| Jaylen Warren | rushing yards | 59.7 | 50.5 or lower | 60.5 or higher |
| Jaylen Warren | receptions | 2.7 | 1.5 or lower | 3.5 or higher |
| DeVonta Smith | receptions | 4.8 | 3.5 or lower | 5.5 or higher |
| DeVonta Smith | receiving yards | 58.3 | 48.5 or lower | 59.5 or higher |
| Aaron Rodgers | passing yards | 194.9 | 180.5 or lower | 200.5 or higher |
| DK Metcalf | receptions | 3.5 | 2.5 or lower | 4.5 or higher |
| DK Metcalf | receiving yards | 43.5 | 35.5 or lower | 44.5 or higher |
Tampa Bay Buccaneers at Detroit Lions: DET 61%
The model has DET at 61% against a market price of 64%. What drives it: EPA per play (+8.0 points), offense (+4.9 points), point margin (+4.7 points). The case against is efficiency (EPA) (-5.8 points). The line is DET -3.5, total 47.5. That is a 3-point gap to the market, so the market likes this side even more than we do: DET is still the more likely winner, but on our numbers the price is rich.
| TB | DET | |
|---|---|---|
| Record | 3-6 | 7-2 |
| Margin per game (pts) | +2.7 | +6.4 |
| Home / road | 2-2 | 5-0 |
| Streak | L1 | W5 |
| Last five | 3-2 | 5-0 |
| Rest days | 14 | 7 |
| Head to head | 1 win | 2 wins |
TB starter: Baker Mayfield. TB out: Jalen McMillan, Antoine Winfield Jr., Josh Hayes. DET starter: Jared Goff. DET out: Aidan Hutchinson, Cade Mays, Thomas Harper. Crew: Adrian Hill has been tough on TB (+1.5 flags a game versus its norm, 4-2 in 6 games).
| Player | Stat | Our projection | Over is a play at | Under is a play at |
|---|---|---|---|---|
| Jahmyr Gibbs | rushing yards | 85.8 | 73.5 or lower | 87.5 or higher |
| Jahmyr Gibbs | receptions | 3.5 | 2.5 or lower | 4.5 or higher |
| Jared Goff | passing yards | 253.6 | 234.5 or lower | 260.5 or higher |
| Baker Mayfield | passing yards | 227.9 | 210.5 or lower | 233.5 or higher |
| Baker Mayfield | rushing yards | 13.4 | 9.5 or lower | 13.5 or higher |
| Bucky Irving | rushing yards | 58.5 | 49.5 or lower | 59.5 or higher |
| Bucky Irving | receptions | 2.6 | 1.5 or lower | 3.5 or higher |
| Amon-Ra St. Brown | receptions | 6.3 | 5.5 or lower | 7.5 or higher |
| Amon-Ra St. Brown | receiving yards | 73.7 | 61.5 or lower | 74.5 or higher |
| Emeka Egbuka | receptions | 4.8 | 3.5 or lower | 5.5 or higher |
| Emeka Egbuka | receiving yards | 55.5 | 45.5 or lower | 56.5 or higher |
Baltimore Ravens at Carolina Panthers: CAR 58%
The model has CAR at 58% against a market price of 57%. What drives it: recent form (+6.6 points), point margin (+4.3 points), motivation (+3.2 points). The case against is EPA per play (-6.6 points). The line is CAR -3.0, total 43.5.
| BAL | CAR | |
|---|---|---|
| Record | 4-6 | 4-5 |
| Margin per game (pts) | -5.0 | -1.9 |
| Home / road | 3-2 | 1-3 |
| Streak | L5 | W1 |
| Last five | 0-5 | 2-3 |
| Rest days | 6 | 7 |
| Head to head | 1 win | 0 wins |
BAL starter: Jacoby Brissett. BAL out: Lamar Jackson, Ethan Pocic, Gerad Lichtenhan, Jaylinn Hawkins, Jovaughn Gwyn. CAR starter: Bryce Young. CAR out: Jonathon Brooks, Bobby Okereke, Brady Christensen, Isaiah Simmons. Crew: Shawn Hochuli has been tough on CAR (+2.2 flags a game versus its norm, 2-1 in 3 games).
| Player | Stat | Our projection | Over is a play at | Under is a play at |
|---|---|---|---|---|
| Chuba Hubbard | rushing yards | 71.7 | 61.5 or lower | 72.5 or higher |
| Chuba Hubbard | receptions | 3.2 | 2.5 or lower | 3.5 or higher |
| Bryce Young | passing yards | 246.2 | 227.5 or lower | 252.5 or higher |
| Derrick Henry | rushing yards | 76.5 | 65.5 or lower | 77.5 or higher |
| Derrick Henry | receptions | 1.5 | 0.5 or lower | 2.5 or higher |
| Tetairoa McMillan | receptions | 4.9 | 3.5 or lower | 5.5 or higher |
| Tetairoa McMillan | receiving yards | 69.1 | 57.5 or lower | 69.5 or higher |
| Jacoby Brissett | passing yards | 227.2 | 209.5 or lower | 232.5 or higher |
| Zay Flowers | receptions | 5.7 | 4.5 or lower | 6.5 or higher |
| Zay Flowers | receiving yards | 68.8 | 57.5 or lower | 69.5 or higher |
New York Jets at Los Angeles Chargers: LAC 57%
The model has LAC at 57% against a market price of 61%. What drives it: recent form (+8.8 points), EPA per play (+4.7 points), efficiency (EPA) (+4.2 points). The case against is point margin (-5.4 points). The line is LAC -3.0, total 41.5. That is a 4-point gap to the market, so the market likes this side even more than we do: LAC is still the more likely winner, but on our numbers the price is rich.
| NYJ | LAC | |
|---|---|---|
| Record | 2-8 | 1-8 |
| Margin per game (pts) | -6.0 | -10.6 |
| Home / road | 1-4 | 0-4 |
| Streak | L5 | W1 |
| Last five | 0-5 | 1-4 |
| Rest days | 7 | 6 |
| Head to head | 0 wins | 1 win |
NYJ starter: Geno Smith. NYJ out: Isaiah Williams, Omar Cooper Jr., David Onyemata, Kiko Mauigoa. LAC starter: Justin Herbert. LAC out: Brenen Thompson, Branson Taylor, Daiyan Henley, Kendall Williamson, Rodney Shelley. Crew: Alex Kemp has been tough on NYJ (+1.2 flags a game versus its norm, 0-4 in 4 games).
| Player | Stat | Our projection | Over is a play at | Under is a play at |
|---|---|---|---|---|
| Justin Herbert | passing yards | 214 | 197.5 or lower | 219.5 or higher |
| Justin Herbert | rushing yards | 29.7 | 21.5 or lower | 28.5 or higher |
| Garrett Wilson | receptions | 5.7 | 4.5 or lower | 6.5 or higher |
| Garrett Wilson | receiving yards | 68.5 | 56.5 or lower | 69.5 or higher |
| Geno Smith | passing yards | 215.5 | 199.5 or lower | 221.5 or higher |
| Omarion Hampton | rushing yards | 68.2 | 58.5 or lower | 69.5 or higher |
| Omarion Hampton | receptions | 1.7 | 0.5 or lower | 2.5 or higher |
| Breece Hall | rushing yards | 47.8 | 40.5 or lower | 48.5 or higher |
| Breece Hall | receptions | 2.7 | 1.5 or lower | 3.5 or higher |
| Adonai Mitchell | receptions | 3.5 | 2.5 or lower | 4.5 or higher |
| Adonai Mitchell | receiving yards | 47.2 | 39.5 or lower | 47.5 or higher |
Las Vegas Raiders at Denver Broncos: DEN 84%
The model has DEN at 84% against a market price of 82%. What drives it: EPA per play (+12.7 points), point margin (+3.6 points), recent form (+2.0 points). The case against is defense (-1.5 points). The line is DEN -10.5, total 41.5.
| LV | DEN | |
|---|---|---|
| Record | 4-6 | 7-2 |
| Margin per game (pts) | -3.8 | +1.3 |
| Home / road | 3-2 | 4-0 |
| Streak | L2 | W5 |
| Last five | 1-4 | 5-0 |
| Rest days | 7 | 14 |
| Head to head | 2 wins | 4 wins |
LV starter: Fernando Mendoza. LV out: Tonka Hemingway. DEN starter: Bo Nix. DEN out: Caleb Lohner. Crew: Carl Cheffers has been friendly to DEN (5-1 in 6 games with this referee, a win rate 18 points above its norm under others).
| Player | Stat | Our projection | Over is a play at | Under is a play at |
|---|---|---|---|---|
| Bo Nix | passing yards | 232.8 | 215.5 or lower | 238.5 or higher |
| Bo Nix | rushing yards | 15.2 | 10.5 or lower | 15.5 or higher |
| Jonah Coleman | rushing yards | 70.2 | 59.5 or lower | 71.5 or higher |
| Jonah Coleman | receptions | 3.4 | 2.5 or lower | 4.5 or higher |
| Brock Bowers | receptions | 4.8 | 3.5 or lower | 5.5 or higher |
| Brock Bowers | receiving yards | 56.6 | 46.5 or lower | 57.5 or higher |
| Jaylen Waddle | receptions | 3.8 | 2.5 or lower | 4.5 or higher |
| Jaylen Waddle | receiving yards | 49 | 40.5 or lower | 49.5 or higher |
| Fernando Mendoza | passing yards | 159.4 | 147.5 or lower | 163.5 or higher |
| Fernando Mendoza | rushing yards | 18.1 | 12.5 or lower | 17.5 or higher |
| J.K. Dobbins | rushing yards | 42.1 | 35.5 or lower | 43.5 or higher |
Jacksonville Jaguars at New York Giants: JAX 70%
The model has JAX at 70% against a market price of 69%. What drives it: EPA per play (+20.2 points), point margin (+11.1 points), offense (+4.5 points). The case against is defense (-1.9 points). The line is JAX -6.0, total 45.5.
| JAX | NYG | |
|---|---|---|
| Record | 7-2 | 5-3-1 |
| Margin per game (pts) | +13.9 | +0.8 |
| Home / road | 3-1 | 3-2 |
| Streak | W3 | L1 |
| Last five | 4-1 | 2-3 |
| Rest days | 7 | 10 |
| Head to head | 0 wins | 1 win |
JAX starter: Trevor Lawrence. JAX out: B.J. Green II, Danny Striggow, Robert Hainsey. NYG starter: J.J. McCarthy. NYG out: Tyrone Tracy Jr. Crew: Craig Wrolstad has been friendly to JAX (-1.7 flags a game versus its norm, 4-1 in 5 games).
| Player | Stat | Our projection | Over is a play at | Under is a play at |
|---|---|---|---|---|
| Trevor Lawrence | passing yards | 247.8 | 229.5 or lower | 254.5 or higher |
| Trevor Lawrence | rushing yards | 12.2 | 8.5 or lower | 12.5 or higher |
| Bhayshul Tuten | rushing yards | 65.6 | 55.5 or lower | 66.5 or higher |
| Bhayshul Tuten | receptions | 1.5 | 0.5 or lower | 2.5 or higher |
| Isaiah Likely | receptions | 5.4 | 4.5 or lower | 6.5 or higher |
| Isaiah Likely | receiving yards | 53.1 | 43.5 or lower | 53.5 or higher |
| Malik Nabers | receptions | 5.2 | 4.5 or lower | 5.5 or higher |
| Malik Nabers | receiving yards | 66.5 | 55.5 or lower | 67.5 or higher |
| Parker Washington | receptions | 4 | 3.5 or lower | 4.5 or higher |
| Parker Washington | receiving yards | 61.7 | 51.5 or lower | 62.5 or higher |
| J.J. McCarthy | passing yards | 193.6 | 178.5 or lower | 198.5 or higher |
| J.J. McCarthy | rushing yards | 16.6 | 11.5 or lower | 16.5 or higher |
Minnesota Vikings at San Francisco 49ers: SF 63%
The model has SF at 63% against a market price of 62%. What drives it: EPA per play (+14.9 points), offense (+6.8 points), point margin (+4.8 points). The case against is efficiency (EPA) (-6.1 points). The line is SF -3.5, total 46.5.
| MIN | SF | |
|---|---|---|
| Record | 7-2 | 8-1 |
| Margin per game (pts) | +5.6 | +9.4 |
| Home / road | 4-1 | 5-0 |
| Streak | W1 | W2 |
| Last five | 3-2 | 4-1 |
| Rest days | 7 | 7 |
| Head to head | 2 wins | 1 win |
MIN starter: Kirk Cousins. MIN out: Kyler Murray, Jordan Addison, Bo Richter. SF starter: Brock Purdy. SF out: Isaac Guerendo, Brandon Aiyuk, Christian Kirk, De'Zhaun Stribling, Nate Hobbs.
| Player | Stat | Our projection | Over is a play at | Under is a play at |
|---|---|---|---|---|
| Kirk Cousins | passing yards | 248.6 | 229.5 or lower | 254.5 or higher |
| Justin Jefferson | receptions | 7 | 5.5 or lower | 7.5 or higher |
| Justin Jefferson | receiving yards | 81.5 | 67.5 or lower | 82.5 or higher |
| Christian McCaffrey | rushing yards | 48.5 | 41.5 or lower | 49.5 or higher |
| Christian McCaffrey | receptions | 3.6 | 2.5 or lower | 4.5 or higher |
| Brock Purdy | passing yards | 221.5 | 204.5 or lower | 227.5 or higher |
| Brock Purdy | rushing yards | 17.6 | 12.5 or lower | 17.5 or higher |
| T.J. Hockenson | receptions | 5 | 3.5 or lower | 5.5 or higher |
| T.J. Hockenson | receiving yards | 48 | 39.5 or lower | 48.5 or higher |
| Aaron Jones Sr. | rushing yards | 42.2 | 35.5 or lower | 43.5 or higher |
| Aaron Jones Sr. | receptions | 2 | 1.5 or lower | 2.5 or higher |
Anytime touchdown list
| Player | Team | Expected | Our probability | Fair price | Take at |
|---|---|---|---|---|---|
| James Cook III | BUF | 1.12 | 67% | -207 | -178 |
| Jahmyr Gibbs | DET | 1.10 | 67% | -200 | -173 |
| Tony Pollard | TEN | 1.10 | 67% | -200 | -173 |
| Bhayshul Tuten | JAX | 1.06 | 65% | -189 | -164 |
| D'Andre Swift | CHI | 1.02 | 64% | -177 | -154 |
| Christian McCaffrey | SF | 0.98 | 62% | -167 | -146 |
| Emmett Johnson | KC | 0.92 | 60% | -151 | -133 |
| Jonah Coleman | DEN | 0.83 | 56% | -129 | -115 |
| Derrick Henry | BAL | 0.82 | 56% | -127 | -114 |
| Josh Allen | BUF | 0.80 | 55% | -123 | -110 |
| Javonte Williams | DAL | 0.79 | 55% | -120 | -108 |
| Bucky Irving | TB | 0.79 | 55% | -120 | -108 |
The NFL card record
22 NFL cards since Oct 1: legs 45-19, -1.31 units (-2.0% ROI) at one unit a leg, props 41-24. Every past card and every graded ticket is on the Model Cards page; the model's full record is on the record page.
Responsible play
This is model output, not betting advice. Verdexed publishes its model's probabilities and edges for informational and entertainment purposes only. Nothing here is a recommendation to place a wager, and no outcome is guaranteed, even the model's highest-confidence picks lose regularly.
You must be of legal betting age in your jurisdiction and located where sports wagering is legal to bet. Sports betting is not available everywhere; know and follow the laws where you are. Never bet more than you can afford to lose, and never chase losses.
If gambling is affecting you or someone you know, help is available. In the US, call or text 1-800-GAMBLER (1-800-426-2537), or visit ncpgambling.org. Please play responsibly.