 NHL2026-11-14
NHL Picks for November 14: CAR 68% Leads a 14-Game Board
By Verdexed Analytics
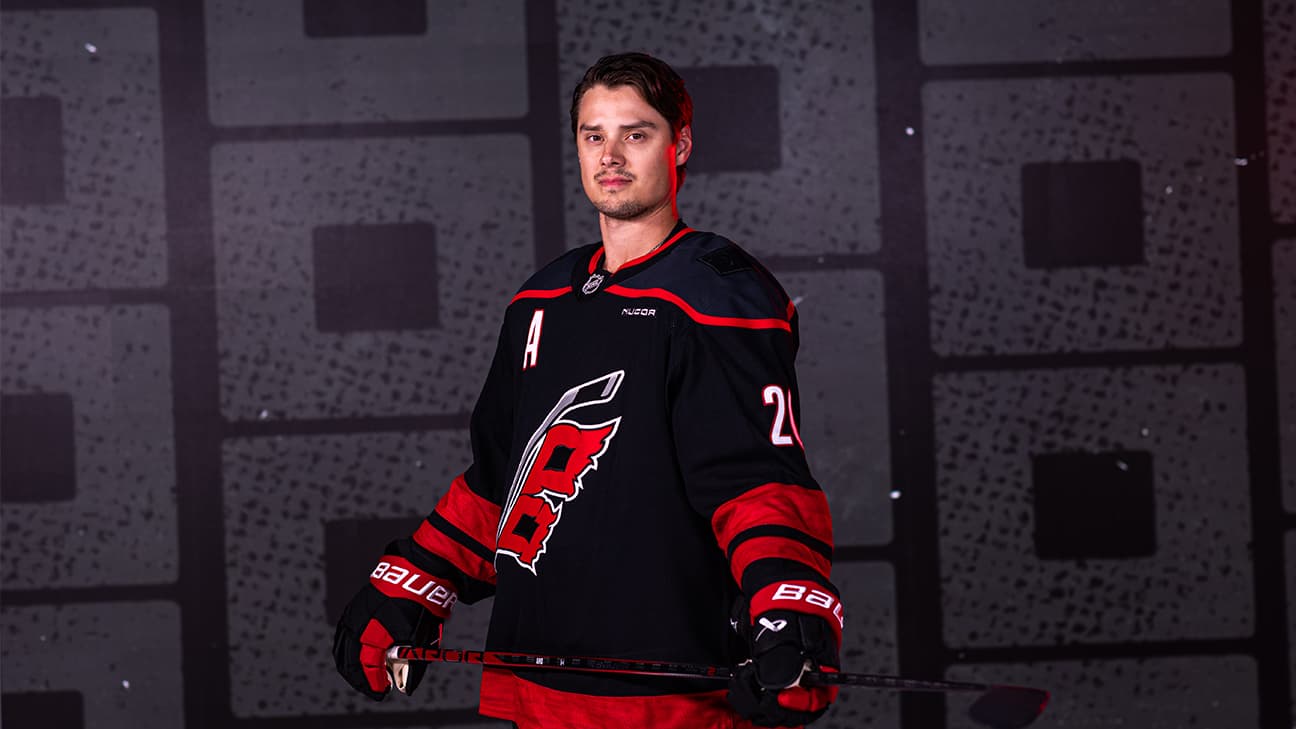
14 NHL games on the board for 2026-11-14. The firmest call is CAR at 68% over SEA; the model and the market are 3 points or more apart on 1. Season to date the model is 187-124 (60.1%) on graded picks, Brier 0.230.
Every number here is the model's own: win probabilities from the point-in-time model blended with the market, the drivers from its feature breakdown, the player lines from the same projections that build the DFS slates, and the crew notes from the referee tables. A player line is the point where our distribution gives that side 57%: the over is a play at that line or lower, the under at that line or higher, at -120 or better.
The board
| Game | Pick | Verdexed | Market | Edge (pts) | Pick price | Line | Total | Card |
|---|---|---|---|---|---|---|---|---|
| SEA at CAR | CAR | 68% | 77% | -9 | -395 | CAR -1.5 | 6.5 | CAR -395 |
| DET at TBL | TBL | 66% | 66% | -1 | -225 | TBL -1.5 | 6.5 | TBL -225 |
| SJS at UTA | UTA | 64% | 64% | 0 | -205 | UTA -1.5 | 6.5 | UTA -205 |
| CGY at LAK | LAK | 60% | 61% | -1 | -175 | LAK -1.5 | 5.5 | LAK -175 |
| WPG at CHI | WPG | 59% | 59% | 0 | -162 | WPG -1.5 | 6.5 | WPG -162 |
| EDM at TOR | EDM | 57% | 57% | 0 | -148 | EDM -1.5 | 6.5 | - |
| BUF at DAL | DAL | 56% | 56% | 0 | -142 | DAL -1.5 | 6.5 | - |
| PHI at CBJ | CBJ | 55% | 55% | 0 | -135 | CBJ -1.5 | 5.5 | - |
| OTT at PIT | OTT | 54% | 54% | 0 | -130 | OTT -1.5 | 6.5 | - |
| NJD at WSH | NJD | 52% | 52% | -1 | -120 | NJD -1.5 | 6.5 | - |
| COL at MTL | MTL | 52% | 53% | -1 | -122 | MTL -1.5 | 6.5 | - |
| MIN at BOS | MIN | 52% | 52% | 0 | -118 | MIN -1.5 | 6.5 | - |
| NYI at ANA | ANA | 51% | 51% | 0 | -115 | ANA -1.5 | 6.5 | - |
| FLA at STL | FLA | 51% | 51% | 0 | -115 | FLA -1.5 | 5.5 | - |
The pick is the more likely winner (the model blended with the market). The Model Card leg is a different question: the side whose price beats the model's own number. In a close game they can point at different teams; both are shown, and both are graded.
Where the model and the market disagree
The market is more confident than we are on these. We still expect the favourite to win, but on our numbers the other side carries the value at the market's price:
CAR over SEA: we make it 68%, the market 77% (a 9-point gap).
Game by game
Seattle Kraken at Carolina Hurricanes: CAR 68%
The model has CAR at 68% against a market price of 77%. What drives it: expected goals (5v5) (+13.0 points), goal margin (+6.7 points), expected goals (+6.4 points). The case against is shot margin (-2.8 points). The line is CAR -1.5, total 6.5. That is a 9-point gap to the market, so the market likes this side even more than we do: CAR is still the more likely winner, but on our numbers the price is rich.
| SEA | CAR | |
|---|---|---|
| Record | 9-7-1 | 15-3-2 |
| Margin per game (goals) | -0.2 | +1.8 |
| Home / road | 4-3 | 6-1 |
| Streak | L2 | W3 |
| Last five | 2-3 | 4-1 |
| Rest days | 2 | 2 |
| Head to head | 2 wins | 4 wins |
SEA starter: Joey Daccord (likely). SEA out: Curtis Douglas, Jake O'Brien, Jacob Melanson, Jared McCann. CAR starter: Pyotr Kochetkov (likely). Crew: Jake Brenk has been tough on SEA (1-7-1 in 9 games with this referee, a win rate 23 points below its norm under others).
| Player | Stat | Our projection | Over is a play at | Under is a play at |
|---|---|---|---|---|
| Sebastian Aho | shots on goal | 2.5 | 1.5 or lower | 3.5 or higher |
| Sebastian Aho | assists | 0.9 | 0.5 or lower | 1.5 or higher |
| Andrei Svechnikov | shots on goal | 3.5 | 2.5 or lower | 4.5 or higher |
| Logan Stankoven | shots on goal | 2.4 | 1.5 or lower | 2.5 or higher |
| Logan Stankoven | assists | 0.9 | 0.5 or lower | 1.5 or higher |
| Nikolaj Ehlers | shots on goal | 2.8 | 1.5 or lower | 3.5 or higher |
| Jackson Blake | shots on goal | 1.8 | 1.5 or lower | 2.5 or higher |
Detroit Red Wings at Tampa Bay Lightning: TBL 66%
The model has TBL at 66% against a market price of 66%. What drives it: goal margin (+5.2 points), expected goals (5v5) (+5.0 points), venue (+3.3 points). The case against is recent form (-1.8 points). The line is TBL -1.5, total 6.5.
| DET | TBL | |
|---|---|---|
| Record | 7-10-3 | 13-4-2 |
| Margin per game (goals) | -0.5 | +0.9 |
| Home / road | 3-5 | 8-0 |
| Streak | L5 | W2 |
| Last five | 0-5 | 4-1 |
| Rest days | 2 | 2 |
| Head to head | 2 wins | 4 wins |
DET starter: Daniil Tarasov (likely). DET out: Dylan Larkin, Albert Johansson, Simon Edvinsson. TBL starter: Andrei Vasilevskiy (likely).
| Player | Stat | Our projection | Over is a play at | Under is a play at |
|---|---|---|---|---|
| Brandon Hagel | shots on goal | 3.4 | 2.5 or lower | 3.5 or higher |
| Nikita Kucherov | shots on goal | 3.4 | 2.5 or lower | 3.5 or higher |
| Nikita Kucherov | assists | 0.9 | 0.5 or lower | 1.5 or higher |
| Jake Guentzel | shots on goal | 2.5 | 1.5 or lower | 2.5 or higher |
| Jake Guentzel | assists | 1.1 | 0.5 or lower | 1.5 or higher |
| John Carlson | shots on goal | 1.8 | 1.5 or lower | 2.5 or higher |
| John Carlson | assists | 1.2 | 0.5 or lower | 1.5 or higher |
| Lucas Raymond | shots on goal | 2.7 | 1.5 or lower | 3.5 or higher |
San Jose Sharks at Utah Mammoth: UTA 64%
The model has UTA at 64% against a market price of 64%. What drives it: expected goals (5v5) (+11.8 points), expected goals (+5.0 points), goal margin (+3.7 points). The case against is rest (-2.0 points). The line is UTA -1.5, total 6.5.
| SJS | UTA | |
|---|---|---|
| Record | 8-11-2 | 10-8-2 |
| Margin per game (goals) | -1.0 | -0.1 |
| Home / road | 4-6 | 4-2 |
| Streak | O1 | O1 |
| Last five | 1-4 | 1-4 |
| Rest days | 3 | 2 |
| Head to head | 3 wins | 3 wins |
SJS starter: Yaroslav Askarov (projected). UTA starter: Karel Vejmelka (projected). UTA out: Logan Cooley, John Marino, Maveric Lamoureux, Nate Schmidt, Dylan Guenther.
| Player | Stat | Our projection | Over is a play at | Under is a play at |
|---|---|---|---|---|
| Macklin Celebrini | shots on goal | 3.9 | 2.5 or lower | 4.5 or higher |
| Clayton Keller | shots on goal | 3 | 2.5 or lower | 3.5 or higher |
| Clayton Keller | assists | 1.1 | 0.5 or lower | 1.5 or higher |
| Mikhail Sergachev | shots on goal | 2.1 | 1.5 or lower | 2.5 or higher |
| Mikhail Sergachev | blocked shots | 1.9 | 1.5 or lower | 2.5 or higher |
| Ivar Stenberg | shots on goal | 2.4 | 1.5 or lower | 2.5 or higher |
| Will Smith | shots on goal | 2.1 | 1.5 or lower | 2.5 or higher |
Calgary Flames at Los Angeles Kings: LAK 60%
The model has LAK at 60% against a market price of 61%. What drives it: expected goals (5v5) (+3.9 points), expected goals (+3.3 points), preseason prior (season-win futures, 17 and 19 games in) (+2.5 points). The case against is rest (-2.1 points). The line is LAK -1.5, total 5.5.
| CGY | LAK | |
|---|---|---|
| Record | 8-10-1 | 5-10-2 |
| Margin per game (goals) | -1.0 | -0.8 |
| Home / road | 2-5 | 2-7 |
| Streak | L1 | L3 |
| Last five | 2-3 | 1-4 |
| Rest days | 3 | 2 |
| Head to head | 5 wins | 1 win |
CGY starter: Devin Cooley (projected). CGY out: Connor Zary, Kevin Bahl, Jonathan Huberdeau. LAK starter: Anton Forsberg (projected).
| Player | Stat | Our projection | Over is a play at | Under is a play at |
|---|---|---|---|---|
| Adrian Kempe | shots on goal | 3.1 | 2.5 or lower | 3.5 or higher |
| Artemi Panarin | shots on goal | 3 | 2.5 or lower | 3.5 or higher |
| Artemi Panarin | assists | 1 | 0.5 or lower | 1.5 or higher |
| Joel Farabee | shots on goal | 2.8 | 1.5 or lower | 3.5 or higher |
| Joel Farabee | blocked shots | 1.3 | 0.5 or lower | 1.5 or higher |
| Alex Laferriere | shots on goal | 3.4 | 2.5 or lower | 3.5 or higher |
| Brandt Clarke | shots on goal | 1.6 | 0.5 or lower | 2.5 or higher |
| Brandt Clarke | blocked shots | 2.7 | 1.5 or lower | 3.5 or higher |
Winnipeg Jets at Chicago Blackhawks: WPG 59%
The model has WPG at 59% against a market price of 59%. What drives it: expected goals (5v5) (+6.8 points), goal margin (+6.1 points), venue (+4.0 points). The case against is preseason prior (season-win futures, 19 and 20 games in) (-2.4 points). The line is WPG -1.5, total 6.5.
| WPG | CHI | |
|---|---|---|
| Record | 9-8-3 | 5-13-1 |
| Margin per game (goals) | -0.3 | -1.9 |
| Home / road | 4-4 | 5-5 |
| Streak | W5 | W1 |
| Last five | 5-0 | 1-4 |
| Rest days | 2 | 2 |
| Head to head | 4 wins | 2 wins |
WPG starter: Stuart Skinner (projected). WPG out: Vladislav Namestnikov, Dylan DeMelo, Elias Salomonsson, Isak Rosen. CHI starter: Spencer Knight (projected). CHI out: Bowen Byram.
| Player | Stat | Our projection | Over is a play at | Under is a play at |
|---|---|---|---|---|
| Kyle Connor | shots on goal | 4.3 | 3.5 or lower | 4.5 or higher |
| Mark Scheifele | shots on goal | 1.9 | 1.5 or lower | 2.5 or higher |
| Mark Scheifele | assists | 1.1 | 0.5 or lower | 1.5 or higher |
| Cole Perfetti | shots on goal | 2.9 | 2.5 or lower | 3.5 or higher |
| Cole Perfetti | assists | 1 | 0.5 or lower | 1.5 or higher |
| Dawson Mercer | shots on goal | 2.1 | 1.5 or lower | 2.5 or higher |
| Connor Bedard | shots on goal | 2.8 | 1.5 or lower | 3.5 or higher |
| Connor Bedard | assists | 0.9 | 0.5 or lower | 1.5 or higher |
Edmonton Oilers at Toronto Maple Leafs: EDM 57%
The model has EDM at 57% against a market price of 57%. What drives it: goal margin (+6.0 points), expected goals (5v5) (+3.3 points), expected goals (+2.8 points). The case against is recent form (-2.0 points). The line is EDM -1.5, total 6.5.
| EDM | TOR | |
|---|---|---|
| Record | 14-3-3 | 8-11-2 |
| Margin per game (goals) | +1.1 | -0.3 |
| Home / road | 7-0 | 4-8 |
| Streak | W3 | L5 |
| Last five | 3-2 | 0-5 |
| Rest days | 3 | 2 |
| Head to head | 1 win | 5 wins |
EDM starter: Devon Levi (projected). EDM out: Frederik Andersen, Matt Savoie, Mattias Janmark, Alec Regula, Isaac Howard. TOR starter: Anthony Stolarz. TOR out: Colton Sissons, Max Domi, Marshall Rifai, Nick Blankenburg, Kirill Marchenko.
| Player | Stat | Our projection | Over is a play at | Under is a play at |
|---|---|---|---|---|
| Leon Draisaitl | shots on goal | 4.1 | 3.5 or lower | 4.5 or higher |
| Connor McDavid | shots on goal | 2.3 | 1.5 or lower | 2.5 or higher |
| Connor McDavid | assists | 1.6 | 0.5 or lower | 2.5 or higher |
| Evan Bouchard | shots on goal | 1.9 | 1.5 or lower | 2.5 or higher |
| Evan Bouchard | assists | 0.9 | 0.5 or lower | 1.5 or higher |
| Auston Matthews | shots on goal | 3.2 | 2.5 or lower | 3.5 or higher |
| Auston Matthews | blocked shots | 1.3 | 0.5 or lower | 1.5 or higher |
| Jack Roslovic | shots on goal | 3 | 2.5 or lower | 3.5 or higher |
Buffalo Sabres at Dallas Stars: DAL 56%
The model has DAL at 56% against a market price of 56%. What drives it: goal margin (+3.7 points), venue (+2.8 points), penalty kill (+1.7 points). The case against is high-danger chances (-0.8 points). The line is DAL -1.5, total 6.5.
| BUF | DAL | |
|---|---|---|
| Record | 8-7-4 | 10-6-2 |
| Margin per game (goals) | -0.7 | +0.2 |
| Home / road | 4-1 | 6-5 |
| Streak | O1 | L1 |
| Last five | 1-4 | 3-2 |
| Rest days | 2 | 2 |
| Head to head | 2 wins | 4 wins |
BUF starter: Alex Lyon (projected). BUF out: Konsta Helenius, Matt Grzelcyk, Justin Danforth. DAL starter: Jake Oettinger (projected). DAL out: Matt Duchene, Kyle Capobianco, Lian Bichsel, Miro Heiskanen.
| Player | Stat | Our projection | Over is a play at | Under is a play at |
|---|---|---|---|---|
| Jason Robertson | shots on goal | 3.1 | 2.5 or lower | 3.5 or higher |
| Thomas Harley | shots on goal | 1.9 | 1.5 or lower | 2.5 or higher |
| Thomas Harley | assists | 0.9 | 0.5 or lower | 1.5 or higher |
| Roope Hintz | shots on goal | 2.2 | 1.5 or lower | 2.5 or higher |
| Wyatt Johnston | shots on goal | 2.8 | 1.5 or lower | 3.5 or higher |
| Wyatt Johnston | assists | 0.9 | 0.5 or lower | 1.5 or higher |
| Tage Thompson | shots on goal | 2.7 | 1.5 or lower | 3.5 or higher |
Philadelphia Flyers at Columbus Blue Jackets: CBJ 55%
The model has CBJ at 55% against a market price of 55%. What drives it: head to head (+3.0 points), expected goals (5v5) (+2.6 points), goal margin (+1.9 points). The case against is rest (-2.2 points). The line is CBJ -1.5, total 5.5.
| PHI | CBJ | |
|---|---|---|
| Record | 5-10-6 | 7-10 |
| Margin per game (goals) | -1.0 | -0.7 |
| Home / road | 2-6 | 6-5 |
| Streak | O1 | L3 |
| Last five | 1-4 | 2-3 |
| Rest days | 3 | 2 |
| Head to head | 0 wins | 6 wins |
PHI starter: Joseph Woll (projected). PHI out: Nikita Grebenkin. CBJ starter: Jet Greaves.
| Player | Stat | Our projection | Over is a play at | Under is a play at |
|---|---|---|---|---|
| Zach Werenski | shots on goal | 3.6 | 2.5 or lower | 4.5 or higher |
| Zach Werenski | blocked shots | 1.6 | 0.5 or lower | 2.5 or higher |
| Owen Tippett | shots on goal | 3.1 | 2.5 or lower | 3.5 or higher |
| Charlie Coyle | shots on goal | 1.7 | 0.5 or lower | 2.5 or higher |
| Charlie Coyle | blocked shots | 0.9 | 0.5 or lower | 1.5 or higher |
| Ivan Provorov | shots on goal | 2.6 | 1.5 or lower | 3.5 or higher |
| Ivan Provorov | blocked shots | 0.9 | 0.5 or lower | 1.5 or higher |
| Travis Sanheim | shots on goal | 1.8 | 1.5 or lower | 2.5 or higher |
| Travis Sanheim | blocked shots | 1.7 | 0.5 or lower | 2.5 or higher |
Ottawa Senators at Pittsburgh Penguins: OTT 54%
The model has OTT at 54% against a market price of 54%. What drives it: goal margin (+2.4 points), expected goals (+1.7 points), shot margin (+1.1 points). The case against is rest (-2.2 points). The line is OTT -1.5, total 6.5.
| OTT | PIT | |
|---|---|---|
| Record | 12-6-2 | 7-10-2 |
| Margin per game (goals) | +0.2 | -0.3 |
| Home / road | 5-4 | 4-3 |
| Streak | W1 | W1 |
| Last five | 3-2 | 2-3 |
| Rest days | 2 | 3 |
| Head to head | 4 wins | 2 wins |
OTT starter: Linus Ullmark. OTT out: Nick Cousins, Andre Burakovsky, Warren Foegele, William Eklund. PIT starter: Sergei Murashov. PIT out: Ryan Graves, Trevor van Riemsdyk, Bryan Rust, Elmer Soderblom. Crew: Garrett Rank has been tough on PIT (+0.7 penalties a game versus its norm, 3-6-2 in 11 games).
| Player | Stat | Our projection | Over is a play at | Under is a play at |
|---|---|---|---|---|
| Linus Ullmark | saves | 24.9 | 22.5 or lower | 25.5 or higher |
| Linus Ullmark | goals against | 2.1 | 1.5 or lower | 2.5 or higher |
| Evgeni Malkin | shots on goal | 2.3 | 1.5 or lower | 2.5 or higher |
| Evgeni Malkin | assists | 1.1 | 0.5 or lower | 1.5 or higher |
| Shane Pinto | shots on goal | 1.6 | 0.5 or lower | 2.5 or higher |
| Tim Stützle | shots on goal | 2.4 | 1.5 or lower | 2.5 or higher |
| Rickard Rakell | shots on goal | 2.3 | 1.5 or lower | 2.5 or higher |
New Jersey Devils at Washington Capitals: NJD 52%
The model has NJD at 52% against a market price of 52%. What drives it: expected goals (+4.9 points), shot share (Corsi) (+3.7 points), goal margin (+3.7 points). The case against is shot margin (-2.6 points). The line is NJD -1.5, total 6.5.
| NJD | WSH | |
|---|---|---|
| Record | 14-6 | 10-7 |
| Margin per game (goals) | +0.8 | +0.0 |
| Home / road | 5-4 | 7-4 |
| Streak | W1 | L1 |
| Last five | 4-1 | 2-3 |
| Rest days | 2 | 2 |
| Head to head | 3 wins | 3 wins |
NJD starter: Connor Hellebuyck. WSH starter: Charlie Lindgren. WSH out: Rasmus Sandin, Vincent Desharnais. Crew: Trevor Hanson has been tough on NJD (+1.0 penalties a game versus its norm, 5-2-0 in 7 games).
| Player | Stat | Our projection | Over is a play at | Under is a play at |
|---|---|---|---|---|
| Jack Hughes | shots on goal | 3.7 | 2.5 or lower | 4.5 or higher |
| Jack Hughes | assists | 1.1 | 0.5 or lower | 1.5 or higher |
| Jesper Bratt | shots on goal | 2.6 | 1.5 or lower | 3.5 or higher |
| Jesper Bratt | assists | 1 | 0.5 or lower | 1.5 or higher |
| Timo Meier | shots on goal | 4.5 | 3.5 or lower | 5.5 or higher |
| Jakob Chychrun | shots on goal | 3.1 | 2.5 or lower | 3.5 or higher |
| Jakob Chychrun | blocked shots | 2.1 | 1.5 or lower | 2.5 or higher |
| Ryan Leonard | shots on goal | 2.7 | 1.5 or lower | 3.5 or higher |
Colorado Avalanche at Montréal Canadiens: MTL 52%
The model has MTL at 52% against a market price of 53%. What drives it: shot margin (+1.4 points), preseason prior (season-win futures, 19 and 20 games in) (+1.0 points), high-danger chances (+0.7 points). The case against is expected goals (5v5) (-6.5 points). The line is MTL -1.5, total 6.5.
| COL | MTL | |
|---|---|---|
| Record | 11-6-3 | 12-3-4 |
| Margin per game (goals) | +0.9 | +0.5 |
| Home / road | 4-5 | 5-2 |
| Streak | O1 | W1 |
| Last five | 2-3 | 3-2 |
| Rest days | 2 | 2 |
| Head to head | 2 wins | 4 wins |
COL starter: Mackenzie Blackwood (projected). COL out: Nathan MacKinnon, Josh Manson, Zachary L'Heureux. MTL starter: Jakub Dobes. MTL out: Chris Kreider, Ivan Demidov, Sam Montembeault. Crew: Kelly Sutherland has been tough on COL (6-6-2 in 14 games with this referee, a win rate 16 points below its norm under others). Crew: Kelly Sutherland has been tough on MTL (4-8-2 in 14 games with this referee, a win rate 20 points below its norm under others).
| Player | Stat | Our projection | Over is a play at | Under is a play at |
|---|---|---|---|---|
| Cole Caufield | shots on goal | 3.7 | 2.5 or lower | 4.5 or higher |
| Nick Suzuki | shots on goal | 2.3 | 1.5 or lower | 2.5 or higher |
| Martin Necas | shots on goal | 1.9 | 1.5 or lower | 2.5 or higher |
| Lane Hutson | shots on goal | 2.2 | 1.5 or lower | 2.5 or higher |
| Lane Hutson | assists | 0.9 | 0.5 or lower | 1.5 or higher |
| Artturi Lehkonen | shots on goal | 2.4 | 1.5 or lower | 2.5 or higher |
Minnesota Wild at Boston Bruins: MIN 52%
The model has MIN at 52% against a market price of 52%. What drives it: expected goals (+3.9 points), expected goals (5v5) (+1.7 points), shot share (Corsi) (+1.3 points). The case against is venue (-3.3 points). The line is MIN -1.5, total 6.5.
| MIN | BOS | |
|---|---|---|
| Record | 14-3-4 | 13-5-1 |
| Margin per game (goals) | +1.1 | +1.3 |
| Home / road | 9-3 | 8-2 |
| Streak | W2 | L1 |
| Last five | 4-1 | 4-1 |
| Rest days | 2 | 2 |
| Head to head | 4 wins | 2 wins |
MIN starter: Jesper Wallstedt (projected). MIN out: Filip Gustavsson. BOS starter: Jeremy Swayman. BOS out: James Hagens. Crew: Chris Rooney has been friendly to BOS (-1.1 penalties a game versus its norm, 6-4-1 in 11 games). Crew: Chris Rooney has been tough on MIN (3-7-2 in 12 games with this referee, a win rate 24 points below its norm under others).
| Player | Stat | Our projection | Over is a play at | Under is a play at |
|---|---|---|---|---|
| Kirill Kaprizov | shots on goal | 2.9 | 2.5 or lower | 3.5 or higher |
| Kirill Kaprizov | assists | 1.2 | 0.5 or lower | 1.5 or higher |
| Matt Boldy | shots on goal | 3.8 | 2.5 or lower | 4.5 or higher |
| David Pastrnak | shots on goal | 3.6 | 2.5 or lower | 4.5 or higher |
| David Pastrnak | assists | 0.9 | 0.5 or lower | 1.5 or higher |
| Morgan Geekie | shots on goal | 2.4 | 1.5 or lower | 2.5 or higher |
| Quinn Hughes | shots on goal | 1.9 | 1.5 or lower | 2.5 or higher |
| Quinn Hughes | assists | 1 | 0.5 or lower | 1.5 or higher |
New York Islanders at Anaheim Ducks: ANA 51%
The model has ANA at 51% against a market price of 51%. What drives it: rest (+2.2 points), power play (+1.7 points), expected goals (+1.7 points). The case against is venue (-3.9 points). The line is ANA -1.5, total 6.5.
| NYI | ANA | |
|---|---|---|
| Record | 8-6-4 | 10-8-1 |
| Margin per game (goals) | +0.0 | +0.1 |
| Home / road | 4-3 | 3-5 |
| Streak | W1 | L1 |
| Last five | 1-4 | 4-1 |
| Rest days | 2 | 3 |
| Head to head | 3 wins | 3 wins |
NYI starter: Ilya Sorokin (projected). NYI out: Calum Ritchie, Mathew Barzal, Alexander Romanov. ANA starter: Ville Husso (projected). ANA out: Ryan Poehling, Ian Moore, A.J. Greer.
| Player | Stat | Our projection | Over is a play at | Under is a play at |
|---|---|---|---|---|
| Cutter Gauthier | shots on goal | 4.3 | 3.5 or lower | 4.5 or higher |
| Mikael Granlund | shots on goal | 1.7 | 1.5 or lower | 2.5 or higher |
| Mikael Granlund | assists | 1.1 | 0.5 or lower | 1.5 or higher |
| Beckett Sennecke | shots on goal | 2.3 | 1.5 or lower | 2.5 or higher |
| Beckett Sennecke | assists | 1.2 | 0.5 or lower | 1.5 or higher |
| Matthew Schaefer | shots on goal | 2.7 | 1.5 or lower | 3.5 or higher |
| Matthew Schaefer | blocked shots | 1.1 | 0.5 or lower | 1.5 or higher |
| Victor Eklund | shots on goal | 2 | 1.5 or lower | 2.5 or higher |
Florida Panthers at St. Louis Blues: FLA 51%
The model has FLA at 51% against a market price of 51%. What drives it: shot share (Corsi) (+2.6 points), expected goals (+2.3 points), goal margin (+1.4 points). The case against is shot margin (-1.3 points). The line is FLA -1.5, total 5.5.
| FLA | STL | |
|---|---|---|
| Record | 11-7-2 | 9-8-2 |
| Margin per game (goals) | +0.2 | -0.1 |
| Home / road | 6-5 | 5-2 |
| Streak | W2 | W2 |
| Last five | 3-2 | 2-3 |
| Rest days | 2 | 2 |
| Head to head | 3 wins | 3 wins |
FLA starter: Jacob Markstrom (projected). FLA out: Aleksander Barkov, Brad Marchand, Jonah Gadjovich. STL starter: Jordan Binnington (projected). STL out: Dillon Dube, Tyler Tucker. Crew: Justin Kea has been friendly to FLA (-0.7 penalties a game versus its norm, 7-1-1 in 9 games).
| Player | Stat | Our projection | Over is a play at | Under is a play at |
|---|---|---|---|---|
| Brady Tkachuk | shots on goal | 4.7 | 3.5 or lower | 5.5 or higher |
| Sam Reinhart | shots on goal | 3.1 | 2.5 or lower | 3.5 or higher |
| Carter Verhaeghe | shots on goal | 2.5 | 1.5 or lower | 3.5 or higher |
| Matthew Tkachuk | shots on goal | 2.2 | 1.5 or lower | 2.5 or higher |
| Matthew Tkachuk | assists | 1.4 | 0.5 or lower | 1.5 or higher |
| Seth Jones | shots on goal | 2 | 1.5 or lower | 2.5 or higher |
| Seth Jones | blocked shots | 1.7 | 0.5 or lower | 2.5 or higher |
Anytime goal list
| Player | Team | Expected | Our probability | Fair price | Take at |
|---|---|---|---|---|---|
| Cutter Gauthier | ANA | 1.24 | 71% | -246 | -208 |
| Leon Draisaitl | EDM | 1.04 | 65% | -183 | -160 |
| Kyle Connor | WPG | 0.92 | 60% | -151 | -133 |
| Brandon Hagel | TBL | 0.88 | 58% | -141 | -125 |
| Dawson Mercer | WPG | 0.76 | 53% | -114 | -102 |
| Jason Robertson | DAL | 0.75 | 53% | -112 | -101 |
| Cole Caufield | MTL | 0.74 | 52% | -110 | +101 |
| Sebastian Aho | CAR | 0.71 | 51% | -103 | +107 |
| Roman Kantserov | CHI | 0.70 | 50.3% | -101 | +109 |
| Nikita Kucherov | TBL | 0.69 | 49.8% | +101 | +111 |
| Victor Eklund | NYI | 0.68 | 49% | +103 | +114 |
| Morgan Geekie | BOS | 0.66 | 48% | +107 | +118 |
Yesterday's board
2 games, the model went 1-1. The market favourite went 1-1.
| Game | Pick | Verdexed | Model alone | Market | Final | Result | Card |
|---|---|---|---|---|---|---|---|
| NYR at VAN | NYR | 66% | 64% | 66% | NYR 5-1 | Hit | NYR -225 (hit) |
| NSH at VGK | VGK | 60% | 62% | 59% | NSH 3-2 | Miss | VGK -162 (miss) |
The model and the market were on the same side of every game, within five points.
The firmest calls: NYR 66% over VAN (hit), VGK 60% over NSH (miss).
The Model Card is a different question from the pick: the pick is the more likely winner, the card leg is the side whose price beats the model's own number. The card went 1-1 on its 2 legs here.
Season to date through November 13: 187-124 (60.1%), Brier 0.230; market favourites 190-121 on the same games; picks at 60% or better are 68-25.
The record
Graded regular-season picks since 2026-09-29: 187 of 311 (60.1%), Brier score 0.230. The live figure, the hit rate by confidence band and every voided pick with its reason are on the NHL accuracy page.
Responsible play
This is model output, not betting advice. Verdexed publishes its model's probabilities and edges for informational and entertainment purposes only. Nothing here is a recommendation to place a wager, and no outcome is guaranteed, even the model's highest-confidence picks lose regularly.
You must be of legal betting age in your jurisdiction and located where sports wagering is legal to bet. Sports betting is not available everywhere; know and follow the laws where you are. Never bet more than you can afford to lose, and never chase losses.
If gambling is affecting you or someone you know, help is available. In the US, call or text 1-800-GAMBLER (1-800-426-2537), or visit ncpgambling.org. Please play responsibly.