 NBA2026-11-02
NBA Picks for November 2: SA 88% Leads a 15-Game Board
By Verdexed Analytics
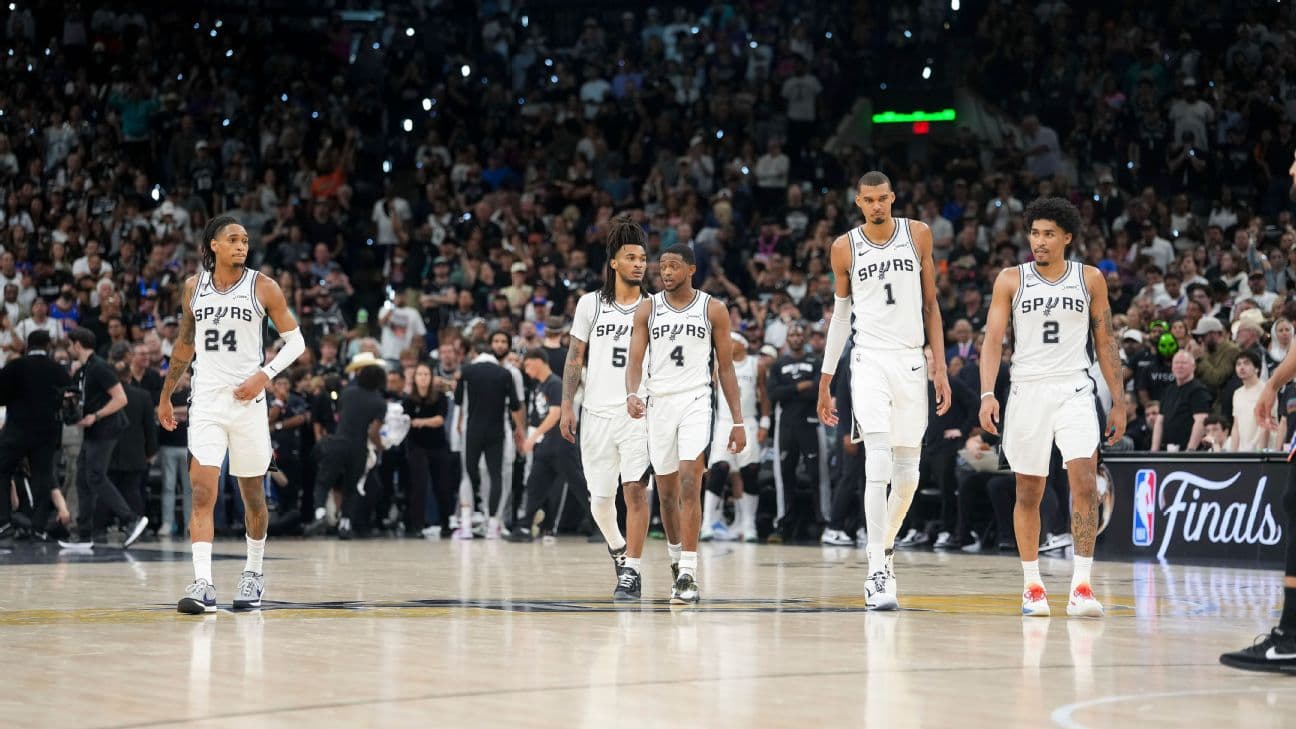
15 NBA games on the board for 2026-11-02. The firmest call is SA at 88% over UTAH; the model and the market are 3 points or more apart on 2. Season to date the model is 64-30 (68.1%) on graded picks, Brier 0.202.
Every number here is the model's own: win probabilities from the point-in-time model blended with the market, the drivers from its feature breakdown, the player lines from the same projections that build the DFS slates, and the crew notes from the referee tables. A player line is the point where our distribution gives that side 57%: the over is a play at that line or lower, the under at that line or higher, at -120 or better.
The board
| Game | Pick | Verdexed | Market | Edge (pts) | Pick price | Line | Total | Card |
|---|---|---|---|---|---|---|---|---|
| UTAH at SA | SA | 88% | 89% | -1 | -1180 | SA -15.5 | 229.5 | SA -1180 |
| BKN at NY | NY | 86% | 87% | -1 | -980 | NY -14.5 | 219.5 | NY -980 |
| CHI at PHI | PHI | 79% | 81% | -2 | -537 | PHI -10.5 | 238.5 | PHI -537 |
| SAC at DAL | DAL | 77% | 77% | 0 | -408 | DAL -10.5 | 232.5 | DAL -408 |
| MIL at MIN | MIN | 77% | 79% | -2 | -470 | MIN -10.5 | 233.5 | MIN -470 |
| POR at DEN | DEN | 64% | 61% | +3 | -174 | DEN -4.5 | 230.5 | DEN -174 |
| TOR at LAC | TOR | 64% | 64% | -1 | -204 | TOR -4.5 | 221.5 | TOR -204 |
| NO at MEM | MEM | 63% | 64% | 0 | -196 | MEM -5.5 | 233.5 | - |
| DET at CHA | DET | 62% | 63% | -2 | -191 | DET -5.5 | 210.5 | - |
| BOS at HOU | HOU | 61% | 63% | -2 | -191 | HOU -4.5 | 218.5 | - |
| ATL at IND | ATL | 60% | 64% | -4 | -199 | ATL -4.5 | 231.5 | - |
| WSH at ORL | ORL | 59% | 57% | +1 | -148 | ORL -2.5 | 225.5 | - |
| OKC at CLE | CLE | 57% | 62% | -5 | -179 | CLE -3.5 | 229.5 | - |
| PHX at GS | GS | 55% | 57% | -2 | -149 | GS -2.5 | 228.5 | - |
| MIA at LAL | LAL | 54% | 53% | +1 | -125 | LAL -1.5 | 236.5 | - |
The pick is the more likely winner (the model blended with the market). The Model Card leg is a different question: the side whose price beats the model's own number. In a close game they can point at different teams; both are shown, and both are graded.
Where the model and the market disagree
The market is more confident than we are on these. We still expect the favourite to win, but on our numbers the other side carries the value at the market's price:
ATL over IND: we make it 60%, the market 64% (a 4-point gap).
CLE over OKC: we make it 57%, the market 62% (a 5-point gap).
Game by game
Utah Jazz at San Antonio Spurs: SA 88%
The model has SA at 88% against a market price of 89%. What drives it: net rating, last 10 (+3.7 points), head to head (+3.2 points), injuries (SA without Harris; UTAH without Jackson, Nurkic, Alexander) (+3.1 points). The case against is preseason prior (season-win futures, 6 and 6 games in) (-4.0 points). The line is SA -15.5, total 229.5.
| UTAH | SA | |
|---|---|---|
| Record | 1-5 | 4-2 |
| Margin per game (pts) | -10.2 | +7.2 |
| Home / road | 0-1 | 2-2 |
| Streak | L4 | W4 |
| Last five | 1-4 | 4-1 |
| Rest days | 2 | 2 |
| Head to head | 1 win | 5 wins |
UTAH out: Jaren Jackson Jr., Jusuf Nurkic, Trey Alexander. SA out: Jayden Quaintance, Tobias Harris.
| Player | Stat | Our projection | Over is a play at | Under is a play at |
|---|---|---|---|---|
| Victor Wembanyama | points | 36.1 | 32.5 or lower | 37.5 or higher |
| Victor Wembanyama | rebounds | 13.5 | 12.5 or lower | 14.5 or higher |
| De'Aaron Fox | points | 20.7 | 18.5 or lower | 21.5 or higher |
| De'Aaron Fox | rebounds | 4.9 | 3.5 or lower | 5.5 or higher |
| Stephon Castle | points | 16.7 | 14.5 or lower | 17.5 or higher |
| Stephon Castle | rebounds | 6.3 | 5.5 or lower | 7.5 or higher |
| Keyonte George | points | 25.7 | 23.5 or lower | 26.5 or higher |
| Keyonte George | rebounds | 4.4 | 3.5 or lower | 5.5 or higher |
| Dylan Harper | points | 18.7 | 16.5 or lower | 19.5 or higher |
| Dylan Harper | rebounds | 5.3 | 4.5 or lower | 6.5 or higher |
Brooklyn Nets at New York Knicks: NY 86%
The model has NY at 86% against a market price of 87%. What drives it: head to head (+6.3 points), net rating, last 10 (+3.8 points), shooting (eFG) (+2.1 points). The case against is preseason prior (season-win futures, 6 and 6 games in) (-4.0 points). The line is NY -14.5, total 219.5.
| BKN | NY | |
|---|---|---|
| Record | 1-5 | 2-4 |
| Margin per game (pts) | -7.8 | -0.7 |
| Home / road | 1-2 | 1-2 |
| Streak | W1 | L1 |
| Last five | 1-4 | 2-3 |
| Rest days | 1 | 3 |
| Head to head | 0 wins | 6 wins |
BKN out: Egor Demin, Tyler Bilodeau. NY out: Jose Alvarado.
| Player | Stat | Our projection | Over is a play at | Under is a play at |
|---|---|---|---|---|
| Karl-Anthony Towns | points | 22.3 | 20.5 or lower | 23.5 or higher |
| Karl-Anthony Towns | rebounds | 13.5 | 12.5 or lower | 14.5 or higher |
| Jalen Brunson | points | 29.1 | 26.5 or lower | 30.5 or higher |
| Jalen Brunson | rebounds | 3.1 | 2.5 or lower | 3.5 or higher |
| Michael Porter Jr. | points | 21.1 | 19.5 or lower | 22.5 or higher |
| Michael Porter Jr. | rebounds | 7 | 5.5 or lower | 7.5 or higher |
| Julius Randle | points | 18.9 | 17.5 or lower | 19.5 or higher |
| Julius Randle | rebounds | 6.7 | 5.5 or lower | 7.5 or higher |
| OG Anunoby | points | 18.3 | 16.5 or lower | 19.5 or higher |
| OG Anunoby | rebounds | 6.1 | 5.5 or lower | 6.5 or higher |
Chicago Bulls at Philadelphia 76ers: PHI 79%
The model has PHI at 79% against a market price of 81%. What drives it: net rating, last 10 (+3.2 points), preseason prior (season-win futures, 7 and 6 games in) (+2.8 points), streak (+2.4 points). The case against is injuries (PHI without Barlow, Hukporti; Embiid questionable; CHI without Claxton) (-2.0 points). The line is PHI -10.5, total 238.5.
| CHI | PHI | |
|---|---|---|
| Record | 1-5 | 6-1 |
| Margin per game (pts) | -15.8 | +3.9 |
| Home / road | 1-3 | 3-1 |
| Streak | L4 | W3 |
| Last five | 1-4 | 4-1 |
| Rest days | 3 | 2 |
| Head to head | 4 wins | 2 wins |
CHI out: Nic Claxton. PHI out: Ariel Hukporti, Dominick Barlow.
| Player | Stat | Our projection | Over is a play at | Under is a play at |
|---|---|---|---|---|
| LeBron James | points | 21.8 | 19.5 or lower | 22.5 or higher |
| LeBron James | rebounds | 7.9 | 6.5 or lower | 8.5 or higher |
| Tyrese Maxey | points | 30.7 | 27.5 or lower | 31.5 or higher |
| Tyrese Maxey | rebounds | 4.6 | 3.5 or lower | 5.5 or higher |
| Joel Embiid | points | 25.1 | 22.5 or lower | 26.5 or higher |
| Joel Embiid | rebounds | 9.8 | 8.5 or lower | 10.5 or higher |
| Jaylen Brown | points | 26.5 | 24.5 or lower | 27.5 or higher |
| Jaylen Brown | rebounds | 7 | 5.5 or lower | 7.5 or higher |
| Caleb Wilson | points | 25.1 | 22.5 or lower | 26.5 or higher |
| Caleb Wilson | rebounds | 8.1 | 6.5 or lower | 8.5 or higher |
Sacramento Kings at Dallas Mavericks: DAL 77%
The model has DAL at 77% against a market price of 77%. What drives it: net rating, last 10 (+6.9 points), injuries (DAL without Aldama, Lively; SAC without Murray, Raynaud, Cardwell; LaVine day-to-day) (+3.8 points), streak (+2.7 points). The case against is preseason prior (season-win futures, 6 and 6 games in) (-9.6 points). The line is DAL -10.5, total 232.5.
| SAC | DAL | |
|---|---|---|
| Record | 0-6 | 4-2 |
| Margin per game (pts) | -19.0 | +2.5 |
| Home / road | 0-4 | 2-1 |
| Streak | L6 | W3 |
| Last five | 0-5 | 4-1 |
| Rest days | 2 | 3 |
| Head to head | 5 wins | 1 win |
SAC out: Ben Simmons, Dylan Cardwell, Keegan Murray, Maxime Raynaud. DAL out: Dereck Lively II, Santi Aldama, Sergio de Larrea, Tarik Biberovic.
| Player | Stat | Our projection | Over is a play at | Under is a play at |
|---|---|---|---|---|
| Cooper Flagg | points | 30.1 | 27.5 or lower | 31.5 or higher |
| Cooper Flagg | rebounds | 7.7 | 6.5 or lower | 8.5 or higher |
| Domantas Sabonis | points | 21.5 | 19.5 or lower | 22.5 or higher |
| Domantas Sabonis | rebounds | 18.3 | 16.5 or lower | 19.5 or higher |
| Kyrie Irving | points | 26.1 | 23.5 or lower | 27.5 or higher |
| Kyrie Irving | rebounds | 4.1 | 3.5 or lower | 4.5 or higher |
| Darius Acuff Jr. | points | 30.3 | 27.5 or lower | 31.5 or higher |
| Darius Acuff Jr. | rebounds | 4 | 2.5 or lower | 4.5 or higher |
| P.J. Washington | points | 19.1 | 17.5 or lower | 20.5 or higher |
| P.J. Washington | rebounds | 10.9 | 9.5 or lower | 11.5 or higher |
Milwaukee Bucks at Minnesota Timberwolves: MIN 77%
The model has MIN at 77% against a market price of 79%. What drives it: net rating, last 10 (+6.5 points), venue (+4.0 points), defense (+2.1 points). The case against is injuries (MIN without Edwards, DiVincenzo) (-7.4 points). The line is MIN -10.5, total 233.5.
| MIL | MIN | |
|---|---|---|
| Record | 1-5 | 4-3 |
| Margin per game (pts) | -13.2 | +11.3 |
| Home / road | 0-2 | 2-1 |
| Streak | L2 | L1 |
| Last five | 1-4 | 2-3 |
| Rest days | 2 | 2 |
| Head to head | 3 wins | 3 wins |
MIN out: Anthony Edwards, Donte DiVincenzo.
| Player | Stat | Our projection | Over is a play at | Under is a play at |
|---|---|---|---|---|
| LaMelo Ball | points | 22.9 | 20.5 or lower | 23.5 or higher |
| LaMelo Ball | rebounds | 5.4 | 4.5 or lower | 6.5 or higher |
| Ayo Dosunmu | points | 21.6 | 19.5 or lower | 22.5 or higher |
| Ayo Dosunmu | rebounds | 5.9 | 4.5 or lower | 6.5 or higher |
| Jaden McDaniels | points | 20.8 | 18.5 or lower | 21.5 or higher |
| Jaden McDaniels | rebounds | 6.3 | 5.5 or lower | 7.5 or higher |
| Tyler Herro | points | 21 | 18.5 or lower | 21.5 or higher |
| Tyler Herro | rebounds | 5.1 | 4.5 or lower | 5.5 or higher |
| Rudy Gobert | points | 10 | 8.5 or lower | 10.5 or higher |
| Rudy Gobert | rebounds | 13.2 | 11.5 or lower | 14.5 or higher |
Portland Trail Blazers at Denver Nuggets: DEN 64%
The model has DEN at 64% against a market price of 61%. What drives it: venue (+8.1 points), injuries (DEN without Jones, Strawther; POR without Morant, Sharpe) (+6.3 points), head to head (+5.2 points). The case against is net rating, last 10 (-2.6 points). The line is DEN -4.5, total 230.5. That is a 3-point gap to the market, our side is worth a look at the current price.
| POR | DEN | |
|---|---|---|
| Record | 4-1 | 3-2 |
| Margin per game (pts) | +11.4 | -1.2 |
| Home / road | 3-0 | 1-1 |
| Streak | W1 | W2 |
| Last five | 4-1 | 3-2 |
| Rest days | 2 | 3 |
| Head to head | 2 wins | 4 wins |
POR out: Ja Morant, Shaedon Sharpe. DEN out: Alpha Diallo, Julian Strawther, Spencer Jones.
| Player | Stat | Our projection | Over is a play at | Under is a play at |
|---|---|---|---|---|
| Nikola Jokic | points | 25.4 | 23.5 or lower | 26.5 or higher |
| Nikola Jokic | rebounds | 11.8 | 10.5 or lower | 12.5 or higher |
| Deni Avdija | points | 27.7 | 25.5 or lower | 28.5 or higher |
| Deni Avdija | rebounds | 8.2 | 7.5 or lower | 9.5 or higher |
| Jamal Murray | points | 27.7 | 25.5 or lower | 28.5 or higher |
| Jamal Murray | rebounds | 5.5 | 4.5 or lower | 6.5 or higher |
| Damian Lillard | points | 26.1 | 23.5 or lower | 27.5 or higher |
| Damian Lillard | rebounds | 5.4 | 4.5 or lower | 6.5 or higher |
| Jrue Holiday | points | 18.7 | 16.5 or lower | 19.5 or higher |
| Jrue Holiday | rebounds | 5.5 | 4.5 or lower | 6.5 or higher |
Toronto Raptors at LA Clippers: TOR 64%
The model has TOR at 64% against a market price of 64%. What drives it: net rating, last 10 (+6.3 points), travel (+3.7 points), injuries (LAC without Ingram, Jones, Strus; TOR without Leonard; Poeltl day-to-day) (+3.1 points). The case against is head to head (-7.5 points). The line is TOR -4.5, total 221.5.
| TOR | LAC | |
|---|---|---|
| Record | 3-3 | 1-5 |
| Margin per game (pts) | +7.8 | -7.3 |
| Home / road | 1-2 | 1-1 |
| Streak | L2 | L5 |
| Last five | 2-3 | 0-5 |
| Rest days | 1 | 1 |
| Head to head | 1 win | 5 wins |
TOR out: Kawhi Leonard, Nate Bittle. LAC out: Bradley Beal, Brandon Ingram, Jordan Miller, Max Strus, Yanic Konan Niederhauser.
| Player | Stat | Our projection | Over is a play at | Under is a play at |
|---|---|---|---|---|
| Scottie Barnes | points | 24 | 21.5 or lower | 25.5 or higher |
| Scottie Barnes | rebounds | 7.6 | 6.5 or lower | 8.5 or higher |
| RJ Barrett | points | 21.7 | 19.5 or lower | 22.5 or higher |
| RJ Barrett | rebounds | 6.7 | 5.5 or lower | 7.5 or higher |
| Darius Garland | points | 22.1 | 19.5 or lower | 23.5 or higher |
| Darius Garland | assists | 7.9 | 6.5 or lower | 8.5 or higher |
| Immanuel Quickley | points | 16.1 | 14.5 or lower | 16.5 or higher |
| Immanuel Quickley | rebounds | 4 | 2.5 or lower | 4.5 or higher |
| Isaiah Jackson | points | 10.2 | 8.5 or lower | 10.5 or higher |
| Isaiah Jackson | rebounds | 8.8 | 7.5 or lower | 9.5 or higher |
New Orleans Pelicans at Memphis Grizzlies: MEM 63%
The model has MEM at 63% against a market price of 64%. What drives it: head to head (+3.0 points), streak (+2.7 points), injuries (MEM: Post questionable, Pippen day-to-day; NO without Poole, Missi; Murphy probable) (+2.3 points). The case against is preseason prior (season-win futures, 6 and 6 games in) (-6.6 points). The line is MEM -5.5, total 233.5.
| NO | MEM | |
|---|---|---|
| Record | 2-4 | 6-0 |
| Margin per game (pts) | +1.8 | +15.2 |
| Home / road | 0-2 | 2-0 |
| Streak | W2 | W6 |
| Last five | 2-3 | 5-0 |
| Rest days | 2 | 2 |
| Head to head | 2 wins | 4 wins |
NO out: Jordan Poole, Yves Missi.
| Player | Stat | Our projection | Over is a play at | Under is a play at |
|---|---|---|---|---|
| Cameron Boozer | points | 19.7 | 17.5 or lower | 20.5 or higher |
| Cameron Boozer | rebounds | 11.1 | 9.5 or lower | 12.5 or higher |
| Ty Jerome | points | 24.7 | 22.5 or lower | 25.5 or higher |
| Ty Jerome | rebounds | 3.2 | 2.5 or lower | 3.5 or higher |
| Dejounte Murray | points | 19.8 | 17.5 or lower | 20.5 or higher |
| Dejounte Murray | rebounds | 7 | 5.5 or lower | 7.5 or higher |
| Zion Williamson | points | 24.6 | 22.5 or lower | 25.5 or higher |
| Zion Williamson | rebounds | 6 | 4.5 or lower | 6.5 or higher |
| Trey Murphy III | points | 19.9 | 17.5 or lower | 20.5 or higher |
| Trey Murphy III | rebounds | 5.7 | 4.5 or lower | 6.5 or higher |
Detroit Pistons at Charlotte Hornets: DET 62%
The model has DET at 62% against a market price of 63%. What drives it: head to head (+9.5 points), venue (+8.4 points), net rating, last 10 (+6.6 points). The case against is preseason prior (season-win futures, 7 and 6 games in) (-11.5 points). The line is DET -5.5, total 210.5.
| DET | CHA | |
|---|---|---|
| Record | 5-1 | 3-4 |
| Margin per game (pts) | +8.0 | -8.1 |
| Home / road | 3-1 | 2-2 |
| Streak | W2 | L3 |
| Last five | 4-1 | 2-3 |
| Rest days | 3 | 2 |
| Head to head | 6 wins | 0 wins |
DET out: Isaiah Joe, Jalen Duren. CHA out: Grant Williams, Kon Knueppel.
| Player | Stat | Our projection | Over is a play at | Under is a play at |
|---|---|---|---|---|
| Cade Cunningham | points | 25.2 | 22.5 or lower | 26.5 or higher |
| Cade Cunningham | rebounds | 6.3 | 5.5 or lower | 7.5 or higher |
| Brandon Miller | points | 29.1 | 26.5 or lower | 30.5 or higher |
| Brandon Miller | rebounds | 7.4 | 6.5 or lower | 8.5 or higher |
| Ausar Thompson | points | 10.8 | 9.5 or lower | 11.5 or higher |
| Ausar Thompson | rebounds | 7.9 | 6.5 or lower | 8.5 or higher |
| Paul Reed | points | 14.9 | 13.5 or lower | 15.5 or higher |
| Paul Reed | rebounds | 7.4 | 6.5 or lower | 8.5 or higher |
| Coby White | points | 20.2 | 18.5 or lower | 21.5 or higher |
| Coby White | rebounds | 4 | 2.5 or lower | 4.5 or higher |
Boston Celtics at Houston Rockets: HOU 61%
The model has HOU at 61% against a market price of 63%. What drives it: rest (+3.8 points), net rating, last 10 (+2.9 points), back to back (+2.6 points). The case against is preseason prior (season-win futures, 7 and 6 games in) (-3.3 points). The line is HOU -4.5, total 218.5.
| BOS | HOU | |
|---|---|---|
| Record | 5-1 | 6-1 |
| Margin per game (pts) | +9.5 | +12.4 |
| Home / road | 1-1 | 3-0 |
| Streak | W5 | W1 |
| Last five | 5-0 | 4-1 |
| Rest days | 1 | 2 |
| Head to head | 4 wins | 2 wins |
BOS out: Devin Carter. HOU out: Steven Adams.
| Player | Stat | Our projection | Over is a play at | Under is a play at |
|---|---|---|---|---|
| Alperen Sengun | points | 23.6 | 21.5 or lower | 24.5 or higher |
| Alperen Sengun | rebounds | 9.7 | 8.5 or lower | 10.5 or higher |
| Jayson Tatum | points | 25.8 | 23.5 or lower | 26.5 or higher |
| Jayson Tatum | rebounds | 7.4 | 6.5 or lower | 8.5 or higher |
| Kevin Durant | points | 22.6 | 20.5 or lower | 23.5 or higher |
| Kevin Durant | rebounds | 5.2 | 4.5 or lower | 5.5 or higher |
| Jabari Smith Jr. | points | 18.3 | 16.5 or lower | 19.5 or higher |
| Jabari Smith Jr. | rebounds | 6.6 | 5.5 or lower | 7.5 or higher |
| Paul George | points | 16.2 | 14.5 or lower | 17.5 or higher |
| Paul George | rebounds | 5.5 | 4.5 or lower | 6.5 or higher |
Atlanta Hawks at Indiana Pacers: ATL 60%
The model has ATL at 60% against a market price of 64%. What drives it: venue (+4.2 points), rest (+3.9 points), defense (+2.7 points). The case against is preseason prior (season-win futures, 7 and 7 games in) (-10.2 points). The line is ATL -4.5, total 231.5. That is a 4-point gap to the market, so the market likes this side even more than we do: ATL is still the more likely winner, but on our numbers the price is rich.
| ATL | IND | |
|---|---|---|
| Record | 3-4 | 2-5 |
| Margin per game (pts) | +0.9 | -3.9 |
| Home / road | 2-2 | 0-3 |
| Streak | L1 | L4 |
| Last five | 1-4 | 1-4 |
| Rest days | 2 | 1 |
| Head to head | 4 wins | 2 wins |
ATL out: Henri Veesaar, Jock Landale, Kingston Flemings, Mouhamed Gueye. IND out: Ben Sheppard, Ivica Zubac, Johnny Furphy, T.J. McConnell, Tyrese Haliburton.
| Player | Stat | Our projection | Over is a play at | Under is a play at |
|---|---|---|---|---|
| Jalen Johnson | points | 22.7 | 20.5 or lower | 23.5 or higher |
| Jalen Johnson | rebounds | 10.6 | 9.5 or lower | 11.5 or higher |
| Onyeka Okongwu | points | 18.1 | 16.5 or lower | 19.5 or higher |
| Onyeka Okongwu | rebounds | 10.4 | 9.5 or lower | 11.5 or higher |
| Pascal Siakam | points | 23.3 | 21.5 or lower | 24.5 or higher |
| Pascal Siakam | rebounds | 8.3 | 7.5 or lower | 9.5 or higher |
| Andrew Nembhard | points | 20.8 | 18.5 or lower | 21.5 or higher |
| Andrew Nembhard | rebounds | 2.8 | 1.5 or lower | 3.5 or higher |
| Nickeil Alexander-Walker | points | 23.2 | 20.5 or lower | 24.5 or higher |
| Nickeil Alexander-Walker | rebounds | 3.9 | 2.5 or lower | 4.5 or higher |
Washington Wizards at Orlando Magic: ORL 59%
The model has ORL at 59% against a market price of 57%. What drives it: head to head (+9.3 points), defense (+3.5 points), home/road split (+3.3 points). The case against is injuries (ORL without Banchero, Black, Suggs; WSH without Champagnie, Watkins, Vukcevic; Gill questionable, Sarr day-to-day) (-7.2 points). The line is ORL -2.5, total 225.5.
| WSH | ORL | |
|---|---|---|
| Record | 3-3 | 2-4 |
| Margin per game (pts) | +0.8 | -9.0 |
| Home / road | 1-2 | 0-3 |
| Streak | W1 | L1 |
| Last five | 2-3 | 2-3 |
| Rest days | 3 | 1 |
| Head to head | 1 win | 5 wins |
WSH out: Jamir Watkins, Justin Champagnie, Tristan Vukcevic. ORL out: Anthony Black, Izaiyah Nelson, Jalen Suggs, Jonathan Isaac, Noah Penda.
| Player | Stat | Our projection | Over is a play at | Under is a play at |
|---|---|---|---|---|
| Franz Wagner | points | 25.7 | 23.5 or lower | 26.5 or higher |
| Franz Wagner | rebounds | 8 | 6.5 or lower | 8.5 or higher |
| Anthony Davis | points | 24.5 | 22.5 or lower | 25.5 or higher |
| Anthony Davis | rebounds | 11.7 | 10.5 or lower | 12.5 or higher |
| Trae Young | points | 23.4 | 21.5 or lower | 24.5 or higher |
| Trae Young | rebounds | 4.1 | 3.5 or lower | 4.5 or higher |
| Wendell Carter Jr. | points | 15.7 | 14.5 or lower | 16.5 or higher |
| Wendell Carter Jr. | rebounds | 11.3 | 10.5 or lower | 12.5 or higher |
| Desmond Bane | points | 21.5 | 19.5 or lower | 22.5 or higher |
| Desmond Bane | rebounds | 4.3 | 3.5 or lower | 4.5 or higher |
Oklahoma City Thunder at Cleveland Cavaliers: CLE 57%
The model has CLE at 57% against a market price of 62%. What drives it: venue (+8.7 points), star availability (+4.2 points), injuries (CLE without Watson, Tyson; OKC without Holmgren, Williams, Wallace) (+2.8 points). The case against is head to head (-7.0 points). The line is CLE -3.5, total 229.5. That is a 5-point gap to the market, so the market likes this side even more than we do: CLE is still the more likely winner, but on our numbers the price is rich.
| OKC | CLE | |
|---|---|---|
| Record | 4-2 | 4-2 |
| Margin per game (pts) | -0.5 | +5.0 |
| Home / road | 1-2 | 3-0 |
| Streak | L2 | W1 |
| Last five | 3-2 | 4-1 |
| Rest days | 2 | 2 |
| Head to head | 5 wins | 1 win |
OKC out: Alex Caruso, Cason Wallace, Chet Holmgren, Jalen Williams, Nikola Topic. CLE out: Jaylon Tyson.
| Player | Stat | Our projection | Over is a play at | Under is a play at |
|---|---|---|---|---|
| Shai Gilgeous-Alexander | points | 31.7 | 28.5 or lower | 32.5 or higher |
| Shai Gilgeous-Alexander | rebounds | 4.9 | 3.5 or lower | 5.5 or higher |
| Donovan Mitchell | points | 25.6 | 23.5 or lower | 26.5 or higher |
| Donovan Mitchell | rebounds | 4.8 | 3.5 or lower | 5.5 or higher |
| Ajay Mitchell | points | 23.7 | 21.5 or lower | 24.5 or higher |
| Ajay Mitchell | rebounds | 4.4 | 3.5 or lower | 5.5 or higher |
| James Harden | points | 20.3 | 18.5 or lower | 21.5 or higher |
| James Harden | rebounds | 5.2 | 4.5 or lower | 5.5 or higher |
| Evan Mobley | points | 18.9 | 17.5 or lower | 19.5 or higher |
| Evan Mobley | rebounds | 8.4 | 7.5 or lower | 9.5 or higher |
Phoenix Suns at Golden State Warriors: GS 55%
The model has GS at 55% against a market price of 57%. What drives it: net rating, last 10 (+7.5 points), venue (+6.2 points), streak (+3.4 points). The case against is injuries (GS without Butler, Porzingis, Green; Curry day-to-day; PHX without Williams) (-9.0 points). The line is GS -2.5, total 228.5.
| PHX | GS | |
|---|---|---|
| Record | 1-3 | 4-3 |
| Margin per game (pts) | -12.5 | +2.9 |
| Home / road | 0-2 | 2-1 |
| Streak | L2 | W4 |
| Last five | 1-3 | 4-1 |
| Rest days | 3 | 1 |
| Head to head | 2 wins | 4 wins |
PHX out: Mark Williams. GS out: Gui Santos, Jimmy Butler III, Kristaps Porzingis, Moses Moody.
| Player | Stat | Our projection | Over is a play at | Under is a play at |
|---|---|---|---|---|
| Stephen Curry | points | 32.1 | 29.5 or lower | 33.5 or higher |
| Stephen Curry | rebounds | 4.2 | 3.5 or lower | 4.5 or higher |
| Yaxel Lendeborg | points | 26.2 | 23.5 or lower | 27.5 or higher |
| Yaxel Lendeborg | rebounds | 7.8 | 6.5 or lower | 8.5 or higher |
| Devin Booker | points | 25.5 | 23.5 or lower | 26.5 or higher |
| Devin Booker | rebounds | 3.6 | 2.5 or lower | 4.5 or higher |
| Brandin Podziemski | points | 19 | 17.5 or lower | 19.5 or higher |
| Brandin Podziemski | rebounds | 6.5 | 5.5 or lower | 7.5 or higher |
| De'Anthony Melton | points | 17 | 15.5 or lower | 17.5 or higher |
| De'Anthony Melton | rebounds | 5.5 | 4.5 or lower | 6.5 or higher |
Miami Heat at Los Angeles Lakers: LAL 54%
The model has LAL at 54% against a market price of 53%. What drives it: venue (+4.9 points), shooting (eFG) (+3.7 points), head to head (+2.2 points). The case against is rest (-4.0 points). The line is LAL -1.5, total 236.5.
| MIA | LAL | |
|---|---|---|
| Record | 2-4 | 5-2 |
| Margin per game (pts) | -3.2 | +5.3 |
| Home / road | 1-1 | 3-1 |
| Streak | W2 | W1 |
| Last five | 2-3 | 3-2 |
| Rest days | 3 | 1 |
| Head to head | 3 wins | 3 wins |
LAL out: Adou Thiero, Ziaire Williams.
| Player | Stat | Our projection | Over is a play at | Under is a play at |
|---|---|---|---|---|
| Luka Doncic | points | 38 | 34.5 or lower | 39.5 or higher |
| Luka Doncic | rebounds | 8.2 | 7.5 or lower | 9.5 or higher |
| Giannis Antetokounmpo | points | 28.3 | 25.5 or lower | 29.5 or higher |
| Giannis Antetokounmpo | rebounds | 12.6 | 11.5 or lower | 13.5 or higher |
| Austin Reaves | points | 23.2 | 20.5 or lower | 24.5 or higher |
| Austin Reaves | rebounds | 4.1 | 3.5 or lower | 4.5 or higher |
| Bam Adebayo | points | 18.8 | 16.5 or lower | 19.5 or higher |
| Bam Adebayo | rebounds | 9.2 | 8.5 or lower | 10.5 or higher |
| Walker Kessler | points | 12.3 | 10.5 or lower | 13.5 or higher |
| Walker Kessler | rebounds | 10.8 | 9.5 or lower | 11.5 or higher |
Yesterday's board
4 games, the model went 3-1. The market favourite went 3-1.
| Game | Pick | Verdexed | Model alone | Market | Final | Result | Card |
|---|---|---|---|---|---|---|---|
| BOS at ORL | BOS | 67% | 61% | 69% | BOS 108-97 | Hit | BOS -298 (hit) |
| BKN at IND | IND | 63% | 69% | 60% | BKN 98-90 | Miss | IND -162 (miss) |
| TOR at LAL | LAL | 62% | 61% | 63% | LAL 131-125 | Hit | LAL -155 (hit) |
| LAC at GS | GS | 56% | 58% | 55% | GS 124-112 | Hit | GS -125 (hit) |
Where the model and the market split: IND over BKN: model 69%, market 60%, a 10-point gap; the pick missed. BOS over ORL: model 61%, market 69%, an 8-point gap; the pick hit.
The firmest calls: BOS 67% over ORL (hit), IND 63% over BKN (miss), LAL 62% over TOR (hit).
The Model Card is a different question from the pick: the pick is the more likely winner, the card leg is the side whose price beats the model's own number. The card went 3-1 on its 4 legs here.
Season to date through November 1: 64-30 (68.1%), Brier 0.202; market favourites 62-30 on the 92 with a line; picks at 60% or better are 45-15.
The record
Graded regular-season picks since 2025-11-02: 64 of 94 (68.1%), Brier score 0.202. The live figure, the hit rate by confidence band and every voided pick with its reason are on the NBA accuracy page.
Responsible play
This is model output, not betting advice. Verdexed publishes its model's probabilities and edges for informational and entertainment purposes only. Nothing here is a recommendation to place a wager, and no outcome is guaranteed, even the model's highest-confidence picks lose regularly.
You must be of legal betting age in your jurisdiction and located where sports wagering is legal to bet. Sports betting is not available everywhere; know and follow the laws where you are. Never bet more than you can afford to lose, and never chase losses.
If gambling is affecting you or someone you know, help is available. In the US, call or text 1-800-GAMBLER (1-800-426-2537), or visit ncpgambling.org. Please play responsibly.