 MLB2026-10-03
MLB Picks for October 3: MIL 66% Leads a 3-Game Board
By Verdexed Analytics
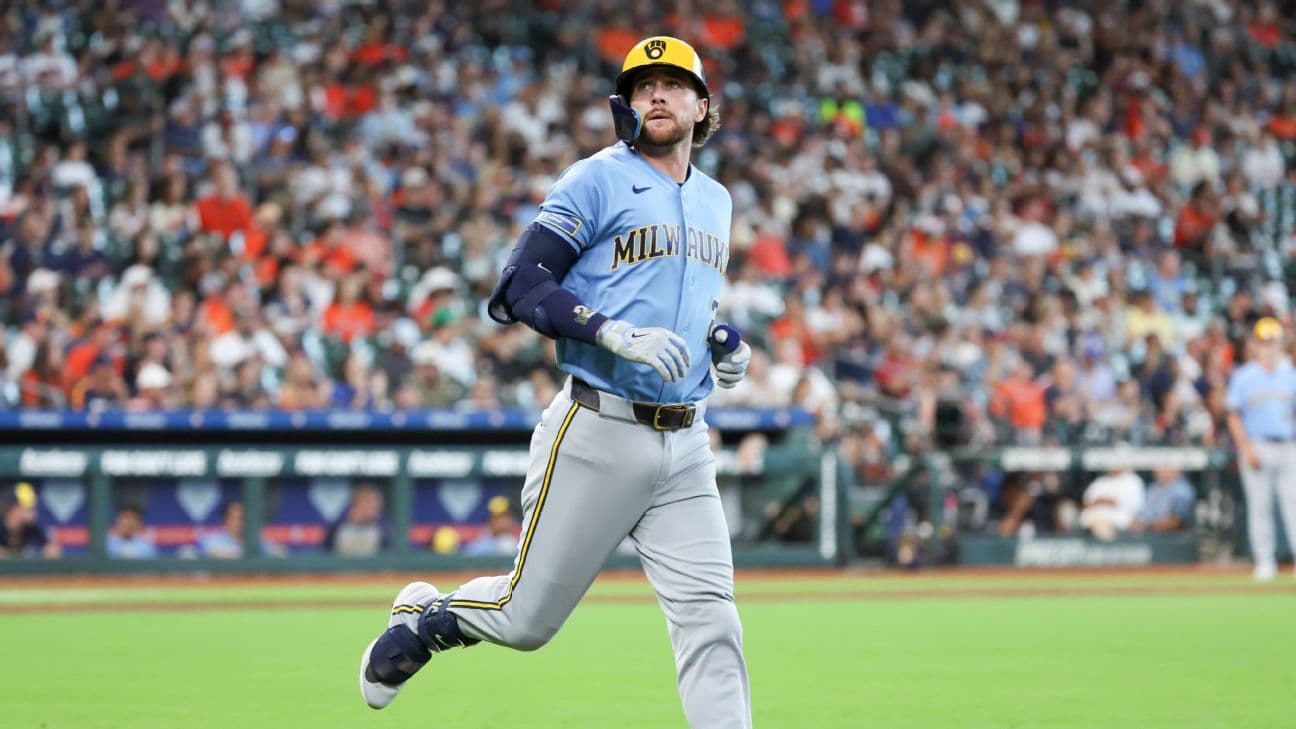
3 MLB games on the board for 2026-10-03. The firmest call is MIL at 66% over SD; the model and the market broadly agree. Season to date the model is 811-622 (56.6%) on graded picks, Brier 0.242.
Every number here is the model's own: win probabilities from the point-in-time model blended with the market, the drivers from its feature breakdown, the player lines from the same projections that build the DFS slates, and the crew notes from the referee tables. A player line is the point where our distribution gives that side 57%: the over is a play at that line or lower, the under at that line or higher, at -120 or better.
The board
| Game | Pick | Verdexed | Market | Edge (pts) | Pick price | Line | Total | Card |
|---|---|---|---|---|---|---|---|---|
| SD at MIL | MIL | 66% | 66% | 0 | -219 | MIL -1.5 | 7 | MIL -203 |
| ATL at LAD | LAD | 64% | 65% | -1 | -212 | LAD -1.5 | 8.5 | LAD -212 |
| NYY at TB | TB | 55% | 55% | 0 | -135 | TB -1.5 | 7 | TB -135 |
The pick is the more likely winner (the model blended with the market). The Model Card leg is a different question: the side whose price beats the model's own number. In a close game they can point at different teams; both are shown, and both are graded.
Game by game
San Diego Padres at Milwaukee Brewers: MIL 66%
The model has MIL at 66% against a market price of 66%. What drives it: home/road split (+3.5 points), venue (+3.5 points), clutch hitting (+2.1 points). The case against is run margin (-0.8 points). The line is MIL -1.5, total 7.
| SD | MIL | |
|---|---|---|
| Record | 91-71 | 103-59 |
| Margin per game (runs) | +0.3 | +1.3 |
| Home / road | 40-41 | 55-26 |
| Streak | W2 | W5 |
| Last five | 4-1 | 5-0 |
| Rest days | 3 | 6 |
| Head to head | 4 wins | 2 wins |
SD out: Bryan Hoeing, Casey Mize, Jeremiah Estrada, Lucas Giolito, Luis Rengifo. MIL out: Angel Zerpa, Brandon Woodruff, Brian Fitzpatrick, Grant Anderson, Quinn Priester.
| Player | Stat | Our projection | Over is a play at | Under is a play at |
|---|---|---|---|---|
| Jacob Misiorowski | strikeouts | 7.1 | 5.5 or lower | 7.5 or higher |
| Jacob Misiorowski | innings pitched | 5.2 | 4.5 or lower | 5.5 or higher |
| Robbie Ray | strikeouts | 4 | 3.5 or lower | 4.5 or higher |
| Robbie Ray | innings pitched | 4.8 | 3.5 or lower | 5.5 or higher |
| Brice Turang | hits | 1.3 | 0.5 or lower | 1.5 or higher |
| Brice Turang | rbis | 0.9 | 0.5 or lower | 1.5 or higher |
| Jackson Chourio | hits | 1 | 0.5 or lower | 1.5 or higher |
| Jackson Chourio | runs | 0.8 | 0.5 or lower | 1.5 or higher |
| Fernando Tatis Jr. | hits | 1.2 | 0.5 or lower | 1.5 or higher |
Atlanta Braves at Los Angeles Dodgers: LAD 64%
The model has LAD at 64% against a market price of 65%. What drives it: venue (+4.7 points), home/road split (+2.2 points), clutch hitting (+1.2 points). The case against is rest (-1.1 points). The line is LAD -1.5, total 8.5.
| ATL | LAD | |
|---|---|---|
| Record | 94-68 | 100-62 |
| Margin per game (runs) | +0.7 | +1.2 |
| Home / road | 42-39 | 51-30 |
| Streak | L1 | W3 |
| Last five | 3-2 | 3-2 |
| Rest days | 2 | 6 |
| Head to head | 5 wins | 1 wins |
ATL out: Bryce Elder, Hurston Waldrep, Joey Wentz, Spencer Schwellenbach, Spencer Strider. LAD out: Ben Casparius, Blake Treinen, Brusdar Graterol, Eric Lauer, Gavin Stone.
| Player | Stat | Our projection | Over is a play at | Under is a play at |
|---|---|---|---|---|
| Tarik Skubal | strikeouts | 6.8 | 5.5 or lower | 7.5 or higher |
| Tarik Skubal | innings pitched | 6.3 | 5.5 or lower | 6.5 or higher |
| Josue De Paula | hits | 1.3 | 0.5 or lower | 1.5 or higher |
| Andy Pages | hits | 1 | 0.5 or lower | 1.5 or higher |
| Mookie Betts | hits | 1 | 0.5 or lower | 1.5 or higher |
New York Yankees at Tampa Bay Rays: TB 55%
The model has TB at 55% against a market price of 55%. What drives it: venue (+3.9 points), home/road split (+1.9 points), power (+0.6 points). The case against is clutch hitting (-0.8 points). The line is TB -1.5, total 7.
| NYY | TB | |
|---|---|---|
| Record | 93-68 | 98-64 |
| Margin per game (runs) | +0.9 | +0.5 |
| Home / road | 47-34 | 55-26 |
| Streak | W1 | L1 |
| Last five | 4-1 | 2-3 |
| Rest days | 3 | 6 |
| Head to head | 4 wins | 2 wins |
NYY out: Clarke Schmidt, Fernando Cruz, Kervin Castro, Aaron Judge. TB out: Edwin Uceta, Jonathan Heasley, Ryan Pepiot, Shane McClanahan, Gavin Lux.
| Player | Stat | Our projection | Over is a play at | Under is a play at |
|---|---|---|---|---|
| Drew Rasmussen | strikeouts | 6 | 4.5 or lower | 6.5 or higher |
| Drew Rasmussen | innings pitched | 6.1 | 5.5 or lower | 6.5 or higher |
| Gerrit Cole | strikeouts | 5.5 | 4.5 or lower | 6.5 or higher |
| Gerrit Cole | innings pitched | 5.7 | 4.5 or lower | 6.5 or higher |
| Ben Rice | hits | 1 | 0.5 or lower | 1.5 or higher |
| Yandy Díaz | hits | 1.1 | 0.5 or lower | 1.5 or higher |
Home run list
| Player | Team | Expected | Our probability | Fair price | Take at |
|---|---|---|---|---|---|
| Ben Rice | NYY | 0.29 | 25% | +297 | +318 |
| Brice Turang | MIL | 0.28 | 24% | +310 | +331 |
| Tommy Edman | LAD | 0.27 | 24% | +322 | +344 |
| Manny Machado | SD | 0.27 | 24% | +322 | +344 |
| George Lombard Jr. | NYY | 0.26 | 23% | +337 | +360 |
| Bo Naylor | MIL | 0.26 | 23% | +337 | +360 |
| Austin Wells | NYY | 0.24 | 21% | +369 | +394 |
| Austin Riley | ATL | 0.23 | 20% | +388 | +413 |
| Junior Caminero | TB | 0.20 | 18% | +452 | +482 |
| Jackson Chourio | MIL | 0.19 | 17% | +478 | +508 |
| Mookie Betts | LAD | 0.19 | 17% | +478 | +508 |
| Andy Pages | LAD | 0.18 | 16% | +506 | +538 |
The record
Graded regular-season picks since 2025-10-03: 811 of 1433 (56.6%), Brier score 0.242. The live figure, the hit rate by confidence band and every voided pick with its reason are on the MLB accuracy page.
How it landed
4 games, the model went 3-1.
| Game | Pick | Verdexed | Model alone | Market | Final | Result | Card |
|---|---|---|---|---|---|---|---|
| SD at MIL | MIL | 65% | 65% | 65% | MIL 3-2 | Hit | MIL -203 (hit) |
| ATL at LAD | LAD | 64% | 56% | 65% | LAD 5-3 | Hit | LAD -212 (hit) |
| CWS at CLE | CLE | 57% | 55% | 57% | CWS 3-0 | Miss | CLE -149 (miss) |
| NYY at TB | TB | 55% | 52% | 55% | TB 1-0 | Hit | TB -135 (hit) |
Where the model and the market split: LAD over ATL: model 56%, market 65%, a 9-point gap; the pick hit.
The firmest calls: MIL 65% over SD (hit), LAD 64% over ATL (hit), CLE 57% over CWS (miss).
The Model Card is a different question from the pick: the pick is the more likely winner, the card leg is the side whose price beats the model's own number. The card went 3-1 on its 4 legs here.
Season to date through October 3: 814-623 (56.6%), Brier 0.242; picks at 60% or better are 176-89.
Responsible play
This is model output, not betting advice. Verdexed publishes its model's probabilities and edges for informational and entertainment purposes only. Nothing here is a recommendation to place a wager, and no outcome is guaranteed, even the model's highest-confidence picks lose regularly.
You must be of legal betting age in your jurisdiction and located where sports wagering is legal to bet. Sports betting is not available everywhere; know and follow the laws where you are. Never bet more than you can afford to lose, and never chase losses.
If gambling is affecting you or someone you know, help is available. In the US, call or text 1-800-GAMBLER (1-800-426-2537), or visit ncpgambling.org. Please play responsibly.